
By Caroline Glackin, PhD and Murat Adivar, PhD
The study applies predictive analytics to data from the 2018 National Salesforce Survey commissioned by the Direct Selling Association. It identifies key factors in salesforce motivation and performance theories studied within Expectancy Theory (Vroom 1964), Herzberg’s (1959) Two Factor Theory, and the job demands and resources model (JD-R) (Bakker and Demerouti 2007). Academic researchers dedicate substantial efforts to studying salesforce motivation and performance, but the power of machine learning has not been applied to direct sellers as independent representatives until now.
By employing supervised learning algorithms for predictive analytics to create models for (1) recruits and (2) existing independent representatives, the study finds that the most crucial factors align with Vroom’s Expectancy Theory (1964), which posits that motivation is influenced by the belief that effort will lead to desired outcomes. For recruits, the key predictors of selling success include allocated time for direct selling, ability to find new customers, gender, and adopting direct selling as a career. Time invested, experience of direct selling, recruitment, tenure, and use of technology are most predictive for top-producing direct sellers. Direct Selling Organizations (DSO) can customize their recruitment, training, and incentives to maximize sales performance by having such analysis for their organizations. This work has the potential to improve the landscape for recruitment, retention, and success.
Literature
DSOs foster an entrepreneurial culture and mindset through entrepreneurial training, tools, and professional networking (Peterson and Wotruba 1996). Crittenden, Crittenden, and Ajjan (2019) state, “Independent distributors are backed by established brands who provide them…quality products, marketing tools, business education, and a wealth of digital resources for professional and personal development.”
Representatives are DSOs’ go-to-market strategy and channel, and revenues depend on successful recruitment, retention, and performance. Because no sales experience is required and recruitment occurs primarily through an independent contractor salesforce, successful selection is essential. With a low entry cost for starter kits (average of $199 per Gamse, 2016), training, mentoring, and performance incentives matter.
DSOs focus on fostering entrepreneurial cultures and offering transparency in the company-distributor-customer dynamic (Fleming 2017). Traditional attitudinal variables like organizational commitment, expectations, satisfaction, and motivation matter (Kim and Machanda 2021). Non-pecuniary benefits, income, personal networks, and autonomy and others influence sellers (Coughlan et al. 2016, Wotruba and Tyagi 1992). These add to the broader sales performance literature.
DSOs have unique brands and cultures, which they share with sellers. This collaborative culture supports networks and promotes teamwork, coaching, and mentoring, rather than fostering competitive sales environments (Bhattacharya and Mehta 2000; Biggart 1989; Crittenden and Crittenden 2004; Lan 2016; Merrilees and Miller 1999). Representatives’ lives are intertwined with the brand and company, finding more than just a job but a community and worldview (Biggart, 1989). They often join for the products and stay for the supportive environment (Coughlan et al. 2016). Research suggests that meeting realistic expectations is more important than overselling for job satisfaction (Wotruba and Tyagi 1992).
The factors identified are like those for salesforces and entrepreneurs. This is logical, considering that direct selling representatives operate as self-employed micro-entrepreneurs with intricately linked relationships to their direct selling companies.
The underlying theoretical frameworks on needs, motivations, and expectations in the literature suggest determinants to examine. While machine learning remains agnostic to theory, classic research continues to add value to the discussion and is incorporated into the framework.
Sales Performance Determinants
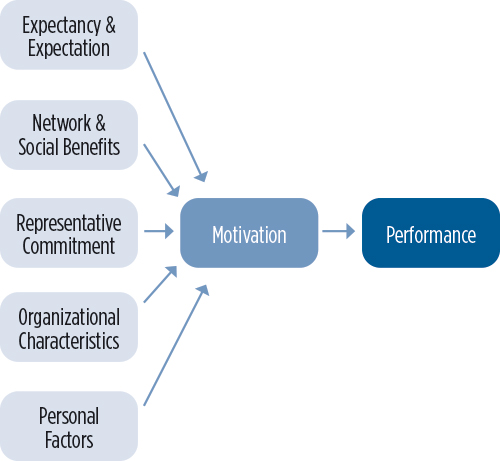
We developed a taxonomy to identify key factors influencing direct selling representative performance, such as education, tenure, and experience. Without forming specific hypotheses, our evidence-driven approach highlights determinants like expectations, social benefits, commitment, organizational traits, and personal factors that impact salesforce motivation and performance. See Figure 1 for details.
Figure 1
Salesforce Performance Determinants from the Literature
Methodology
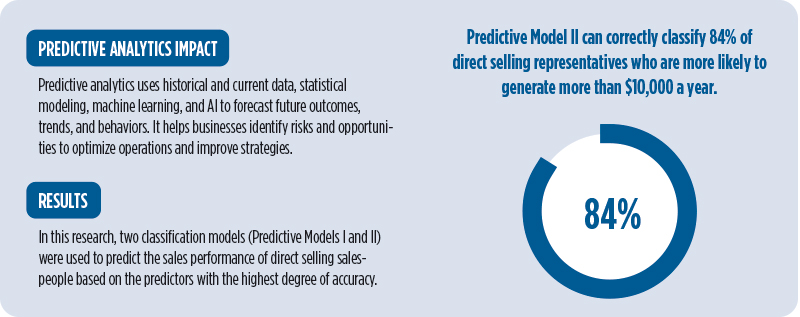
We created two classification models (Model I and Model II) to predict the sales performance of direct selling salespeople based on the predictors with the highest degree of accuracy (see also Glackin and Adivar 2023). Sales performance is assessed by the salesperson’s reported annual direct selling business net income.
A supervised learning approach in which the outcome is the independent sales representative’s financial performance, dependent on some direct seller-specific inputs is the least biased, strongest method available (Glackin and Adivar 2023; Habel et al. 2024). To attain the goal using supervised learning, we employ the 2018 DSA Salesforce Survey dataset of 6,941 direct selling representatives, including a range of personal factors, experiences, attitudes, and interests. DSOs among the 122 members of the Direct Selling Association distributed the survey. The survey queries on the respondent’s gender, desire to dedicate time to direct selling, capacity to find new clients, motives to become and remain representatives, and numerous other topics. The sample for this study is a subset of the entire dataset of 8,714 entries to incorporate active sales representatives who answered the question regarding net income from direct selling and did not respond “don’t know.”
The survey question regarding net income from direct selling is crucial, as it is used to gauge the direct seller’s financial success (performance) of direct sellers. This question in the survey could be answered with one of 15 income levels between $0 and $400,000. Our exploratory analysis indicates that DSOs should identify the characteristics of direct sellers who earn more than $10,000 annually in net income, which results from data clustering and as the accepted norm for “business builders” in direct selling. Even though this is a modest annual net income for a salesperson, it is a crucial level of productivity for the channel. The direct selling channel generated more than $30 billion in annual revenue, according to an approximate extrapolation of industry sales statistics predicting $40.1 billion in revenue in 2020 from the DSA 2021 Growth and Outlook Report. We construct our target response (“Above$10,000”) as a binary variable by combining 15 levels of the categorical variable.
Utilizing domain expertise and current literature, we tested variables that are readily available to DSOs and can predict the financial success of independent salesforces before and after recruitment. Using the variable selection and dimension reduction tools of our data analytics platform, we excluded the tested predictors that had no measured effect on the models’ precision. We combined the recorded states of the dependent variable into two levels as another dimension reduction strategy. Using best practices, we divided the dataset into training and validation sets, compared machine learning methods on the validation set, and raised the target-level accuracy of the selected classification algorithm by adjusting the classification probability threshold.
In this study, we utilize supervised learning to predict high-performing independent sales representatives before and after recruitment. Our supervised learning task is building classification models that predict the class of categorical responses. The data analysis platform is JMP Pro (by SAS) and requires the selection of suitable machine learning algorithms for classification. We employ the following classification techniques and evaluate probable independent variables to build two classification models: Decision Trees, Boosted Tree, Bootstrap Forest, Logistic Regression, and K-Nearest Neighbors. For superior performance in models, the independent variables with the strongest predictive contribution are employed as predictor variables.
Model I – Classification Model for Recruits
We used multiple supervised learning approaches (i.e., Decision Trees, Logistic Regression, Naive Bayes, K-Nearest Neighbors, and Bootstrap Forest) to identify the optimal model for predicting the success of an applicant based on data knowable at recruitment. We explored 16 independent and 14 underlying variables for model building. Model I intended to predict the direct seller recruits that were most likely to earn an annual net income of more than $10,000 from their efforts. Decision (classification) Trees with a particular profit matrix (connected with the goal response) produced the highest classification accuracy. In this study, 78% of validation data at the target level “Above10K=1” were correctly categorized by Model I with the set probability threshold value of 0.21.
These values can be interpreted as follows: In a scenario where a DSO employs this classification model to choose the top 20% of new representatives expected to net more than $10,000 annually from direct selling, the organization will receive 2.5 more target-level applicants than with “no model baseline.”
Table 1
Model I – Recruitment
| Variable | Survey Question/Predetermined Response | Number of Splits | G^2(*) | Portion |
|---|---|---|---|---|
| HOURS_DS | How many hours per week do/did you spend on your direct selling business? | 6 | 789.1447 | 0.6744 |
| ATTEMPT_SELL | In a typical month, how many new potential customers do you attempt to sell to? | 9 | 153.5405 | 0.1312 |
| CAREER | Direct selling is a career for me | 6 | 71.2069 | 0.0609 |
| GENDER | Please indicate your gender | 6 | S1.2537 | 0.0438 |
| DISCOUNT | I get the products at a discount | 6 | 37.5171 | 0.0321 |
| SOCIAL | To meet new people/expand my social circle | 4 | 35.9346 | 0.0307 |
| SUPP_INC | Long-term supplemental income | 9 | 31.487 | 0.0269 |
*In the report, G2 (likelihood-ratio chi-square) is twice the [natural log] entropy or twice the change in entropy. In classification trees, the largest G2 value is the dividing criteria. The portion column indicates die percentage of G2 or the sum of squares attributable to the variable (i.e.. portion column shows the contribution of the variable to the model)
Model II: Classification Model – Active Sales Representatives
In this part, we create a prediction model and identify the most relevant elements influencing the financial performance of current (active) direct salespeople utilizing determinants that are only available once a representative is an active independent representative. This model included 35 independent variables with their comprehensive underlying variables.
The outputs are described in Table 2.
Table 2
Model II – Active Sales Representatives
| Variable | Survey Question/Predetermined Response | Number of Splits | G^2(*) | Portion (* *) |
|---|---|---|---|---|
| DOWNLIINE | q55: What is the total number of independent representatives in your downline? | 2214 | 391.8158 | 0.2493 |
| HOURS_DS | q13: how many hours per week do/did you spend on your direct selling business? | 1504 | 216.9524 | 0.1380 |
| SALESQUAL | q14r4: I have developed a sales team of my own – Please answer the questions below based on your current direct selling experience. | 546 | 176.9932 | 0.1126 |
| TENURE | q19: How long have you represented your company? | 2029 | 130.2316 | 0.0828 |
| SALESTYPE | q38r1: Sales to your customers- Of all the orders you place per month, what percentage are: | 1952 | 128.7537 | 0.0819 |
| SATIS_DS | q2I: How do you rate your actual experience in direct selling? Has it been…? | 1389 | 124.1606 | 0.0790 |
| MET_EXPECT | q20: Now, please think about your expectations when you started direct selling. Has your experience… | 1116 | 90.3898 | 0.0575 |
| VIDEOCONF | q65r5: I use Zoom, Skype, Google Hangouts (or other video conferencing) for business | 1184 | 69.4189 | 0.0442 |
| CAREER | q23r1c2: Direct selling is a career for me | 1072 | 67,2371 | 0.0428 |
| INC_SATIS | q78: How satisfied are you with the amount of money earned for the amount of time you spend on your direct selling business? | 1303 | 62.7765 | 0.0399 |
| SUCCESS_RCRT | q52: In a typical month, how many people do you SUCCESSFULLY recruit? | 958 | 45.0898 | 0.0287 |
| AGE_GR | Age Group | 1550 | 39.6218 | 0.0252 |
| LATINX | q16 (Ethnicity): Are you of Hispanic or Latino origin? | 858 | 28.5079 | 0.0181 |
(* *) Portion column shows the contribution of the variable to the model
The indication column “Above10K” is the response to which our analysis is directed. The estimation of the model’s accuracy is based on the misclassification rate across the validation set. Bootstrap Forest and Boosted Tree outperform other supervised learning algorithms with an 88% overall accuracy value. Nevertheless, in terms of target-level accuracy using the default classification probability threshold (i.e., 0.5), Bootstrap Forests performed best with a classification accuracy rate of 50.4% at the target level. We refer to this Bootstrap Model as Model II.
By applying such a model, the direct selling company will have a 3.66 times greater probability of predicting candidates at the desired level than if there were no model.
To interpret these numbers, assume that a DSO uses this model to estimate the top 20% of existing representatives anticipated to net more than $10,000 annually through direct selling. In this situation, the company will have a 3.66 times greater probability of predicting candidates at the desired level than if there were no model.
Results
Recruitment
Using individual data that DSOs may secure before and at recruitment, Predictive Model-I can generate the probability that a new candidate is a preferred prospect because they are appropriate to the target audience of direct sellers who can generate more than $10,000 net annual income from a direct selling business.
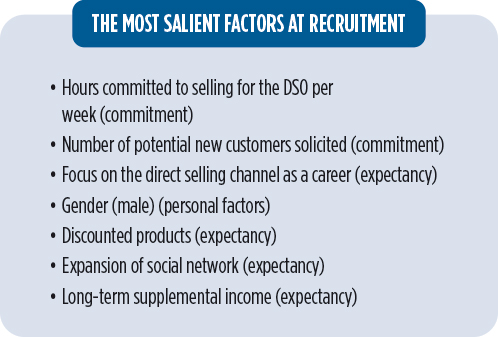
Deploying the predictive Model I on a new population can correctly classify almost 78% of candidates to generate a $10,000 annual net income from direct selling. DSOs can apply such a model to identify and recruit the most productive candidates. Even though 88.3% of representatives are part-time, the top performers are interested in devoting their sales time and view direct selling as a career. While only 11% of direct sellers are male, they are more likely to become top performers (34% versus 15%).
We show that if a direct selling company uses Predictive Model I to select the top 20% of new representatives who are predicted to be most likely to generate more than $10,000 annual net income, the company will get 2.5 times more productive candidates than “no model baseline.” Here, no model baseline classifies everybody as belonging to the majority class (e.g., not likely to make more than $10K) in the historical data. While DSOs do not screen recruits, they could use this data to determine the best prospects and design recruitment materials, campaigns, and support systems to optimize performance, as well as creating adaptive learning systems to support incoming recruit success.
If a direct selling company uses Predictive Model I to select the top 20% of new representatives who are predicted to be most likely to generate more than $10,000 annual net income, the company will get 2.5 times more productive candidates than “no model baseline.”
Retention, Growth, and Performance
By using determinants available only after the recruitment of an independent representative, we calculated the likelihood of financial success in Predictive Model II.
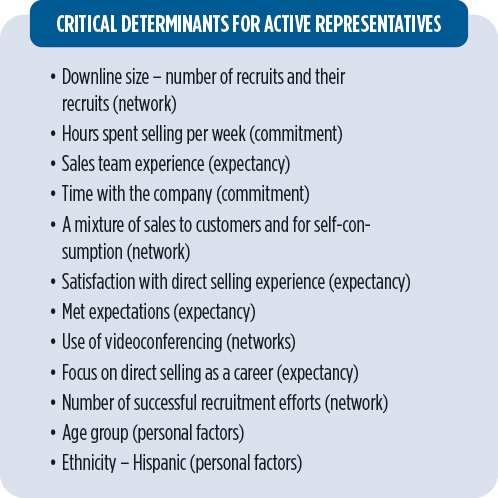
This can assist companies to focus on factors that most significantly contribute to the financial success of direct selling representatives to lead to increased company growth and performance. By using a Bootstrap Forest technique, we show that Predictive Model-II can correctly classify 84% of representatives who are more likely to generate more than $10,000 a year. DSOs can develop organizational training and support based on this knowledge.
Predictive Model-II can correctly classify 84% of representatives who are more likely to generate more than $10,000 a year.
Impacts/Discussion
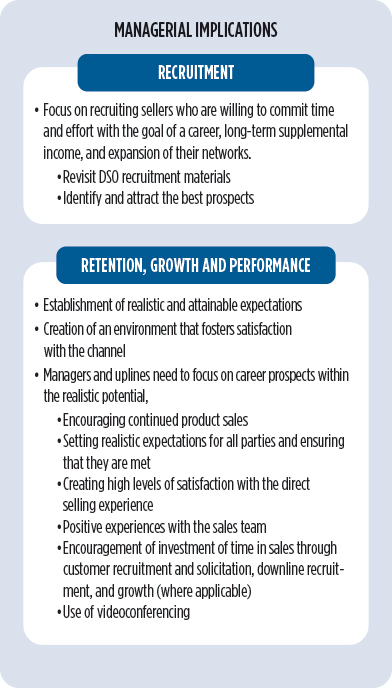
Study outcomes suggest DSOs prioritize recruiting sellers dedicated to building careers (business builders), earning long-term income, and expanding networks. This involves revamping recruitment materials to attract high-quality prospects instead of a broad range of recruits. This approach aims to reduce turnover and resources spent. While ensuring inclusivity, incorporating more male and Latinx representation may enhance sales performance.
DSOs are responsible for retaining and growing their representatives. They must set realistic expectations, create a satisfying environment, encourage product sales, and foster positive experiences within the sales team. Managers should focus on career prospects, recruit customers, grow downlines, and use videoconferencing.
DSOs differ in business models, size, reach, customers, products, missions, and cultures. They can benefit from firm-level predictive analytics and channel-level data insights. However, they should consider the research limitations and improve them with advanced methods.
Dr. Caroline Glackin is the Thomas Family Distinguished Professor of Entrepreneurship at the University of North Carolina Pembroke.
Dr. Murat Adivar is a Professor of Management at Fayetteville State University
References
- Bakker, A. B., & Demerouti, E. (2007). The job demands-resources model: State of the art. Journal of Managerial Psychology, 22(3), 309–328.
- Bhattacharya, P., & Mehta, K. K. (2000). Socialization in network marketing organizations: Is it cult behavior? Journal of Socio-Economics, 29, 361–374.
- Biggart, N. W. (1989). Charismatic Capitalism: Direct Selling Organizations in America. University of Chicago Press.
- Coughlan, A. T., Krafft, M., & Allendorf, J. (2016). Join, stay, leave: A study of direct selling entrepreneurs [Working paper]. SSRN.
- Crittenden, V. L., & Crittenden, W. F. (2004). Developing the sales force, growing the business: The direct selling experience. Business Horizons, 47(5), 39–44.
- Crittenden, V. L., Crittenden, W. F., & Ajjan, H. (2019). Empowering women micro-entrepreneurs in emerging economies: The role of information communications technology. Journal of Business Research, 98, 191–203.
- Fleming, J. (2017, October). Defining distributors versus customers. Direct Selling News, 18–32.
- Gamse, B. (2016). Direct Selling 2016 Salesforce Survey. Direct Selling Association.
- Glackin, C., & Adivar, M. (2023). Modeling independent sales representative performance: application of predictive analytics in direct selling for improved outcomes. Journal of Marketing Analytics, 11(4), 613-628.
- Habel, J., Alavi, S., & Heinitz, N. (2024). Effective implementation of predictive sales analytics. Journal of Marketing Research, 61(4), 718-741.
- Herzberg, F., Mausner, B., & Snyderman, B. B. (1959). The Motivation to Work (2nd ed.). Wiley.
- Kim, E., & Manchanda, P. (2021). The impact of network and spatial embeddedness on salespeople inactivity in direct selling organizations. Nanyang Business School Research Paper No. 20-5.
- Lan, P.-C. (2016). Networking capitalism: Network construction and control effects in direct selling. The Sociological Quarterly, 43(2), 165–184.
- Merrilees, B., & Miller, D. (1999). Direct selling in the West and East: The relative roles of product and relationship (guanxi) drivers. Journal of Business Research, 45(3), 267–273.
- Peterson, R. A., & Wotruba, T. R. (1996). What is direct selling? Journal of Personal Selling & Sales Management, 16(4), 1–16.
- Vroom, V. H. (1964). Work and Motivation. Wiley.
- Wotruba, T. R., & Tyagi, P. K. (1992). Motivation to become a direct salesperson and its relationship with work outcomes. Journal of Marketing Channels, 2(2), 41–56.