All posts in Direct Selling in the US

The Birth of Prosumers: From Passive Consumers to Active Entrepreneurs

By Jae Hwan Lee, PhD and Jiyoon An, PhD

Direct Selling and the Birth of Prosumers

A prosumer is an individual who both consumes and produces a good or service. The term is a portmanteau of the words producer and consumer.

This study contributes to research on prosumption by shifting attention from participation as an outcome to participation as a process of formation. It reframes direct selling as a structured participation system that teaches individuals how to act in markets.

In the Amway materials analyzed here, individuals are shown how to use products, diagnose needs, demonstrate value, interact with others, and advise on product combinations. These practices are not left to improvisation; they are modeled through catalogs, training guides, demonstration formats, recommendation tools, and ordering systems. Through repetition, these practices become recognizable and transferable.

These practices are not unique to one firm. Demonstration, advising, diagnosis, hosting, and facilitation are visible across the direct selling field.

Implications for Platform Economies and Gen Z Participation

Digital environments often make product demonstration, peer advising, community hosting, and transaction facilitation appear new. These activities are especially visible among Generation Z, whose consumption practices are closely intertwined with creator content, peer influence, and social commerce.

The present study suggests that these behaviors are better understood as contemporary reconfigurations of roles that have long been structured in other market contexts. Digital platforms change the medium, scale, speed, and visibility of participation, but they do not eliminate the underlying role logic.

Managerial Implications

The findings have several practical implications for organizations that rely on participant engagement, peer recommendation, social selling, or platform-enabled commerce.

  • Design materials that model action. Scripts, guides, examples, prompts, templates, and transaction tools can help individuals learn how to participate effectively
  • Design for roles rather than isolated tasks. A participant who demonstrates a product may also need to diagnose needs, advise on fit, host interaction, and facilitate exchange. Treating these activities as disconnected tasks may weaken participation. Designing materials and tools around roles can help organizations support more coherent engagement.
  • Role integration. The Amway case suggests that participation becomes more powerful when role integration occurs. A demonstration can lead into diagnosis; diagnosis can lead into advising; advising can lead into facilitation. Strengthen participation through materials that guide individuals across linked forms of engagement rather than supporting each activity separately.
  • Improve digital engagement by designing platform tools that support role transitions: from content viewing to product understanding, from peer discussion to recommendation, and from recommendation to transaction.

Abstract

Direct selling is an innovator in creating a creative consumer role, moving from the mere, passive consumer to the entrepreneurial, active prosumer. Drawing on 27 Amway print advertisements spanning 1970 to 2001, evolving participation roles, such as Early Phase (1970s), Transition Phase (1980s), and Later Phase (1990s- 2001), led to coordinated market participation through foundation roles (e.g., caretaker and diagnostician), interaction roles (e.g., demonstrator and host), and exchange roles (e.g., advisor and facilitator), indicating five core practices (use, diagnose, demonstrate, interact, and advise) that stabilize into six recognizable roles. These novel insights reframe direct selling as a structured formation system rather than a distribution channel, thereby repositioning consumers as prosumers with a learned capability. Prior to the age of platform economy via social media, this role transition enabled them to engage with the community by taking on active roles, including content demonstration, peer advising, community hosting, and transaction facilitation, demonstrating how the artifacts function as enactments across different infrastructures.

Introduction

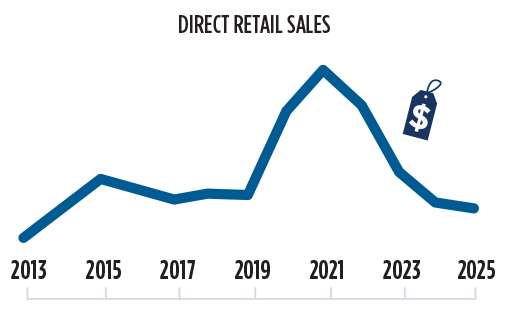
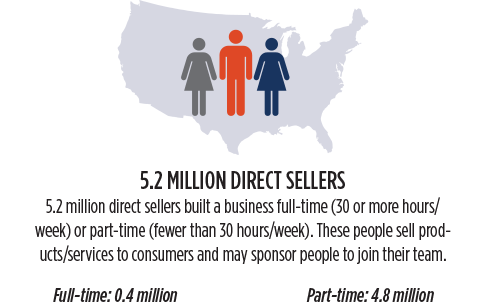
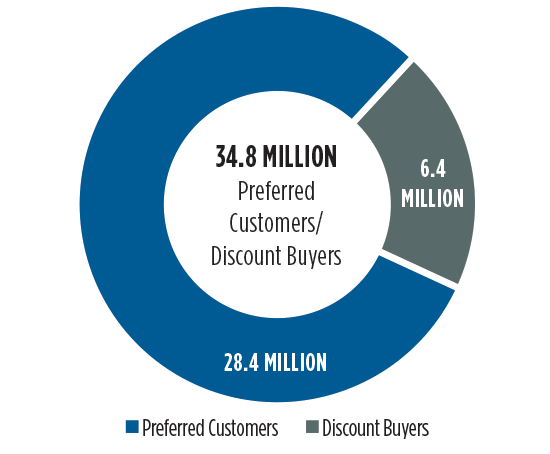
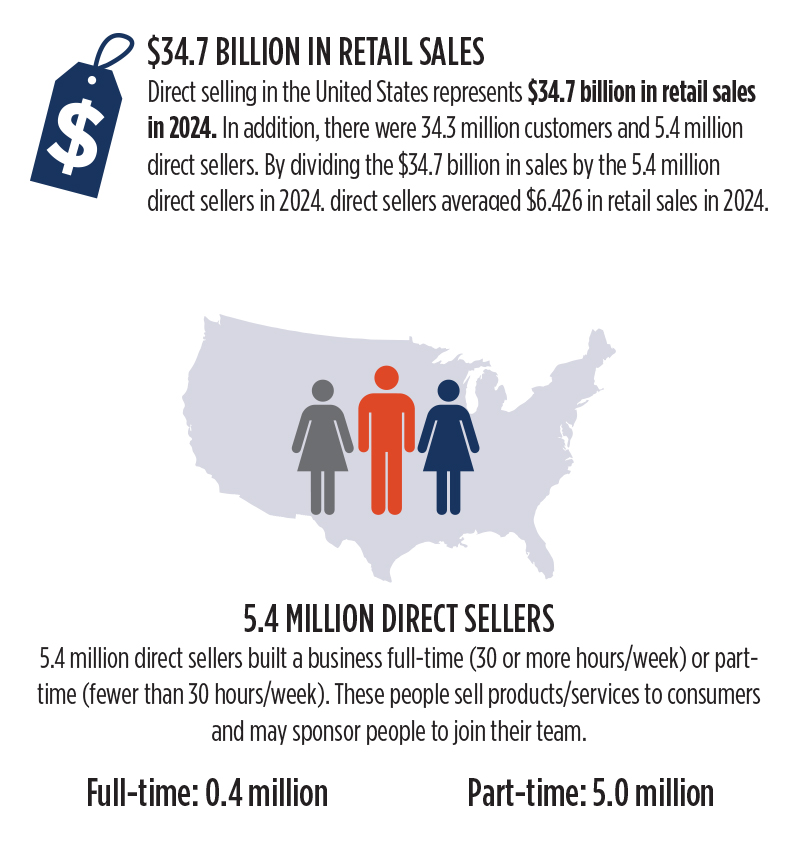
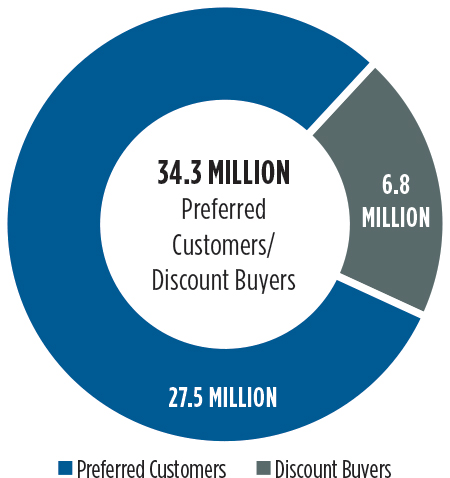
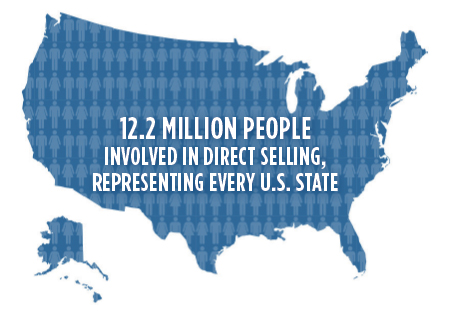
In many markets, individuals do more than consume products; they demonstrate them, recommend them, and help others make decisions. These activities blur the boundary between consumption and participation, positioning individuals as active contributors to how products are communicated and exchanged (Cova & Dalli, 2009; Ritzer & Jurgenson, 2010). Yet this familiar observation conceals a more fundamental question: how do individuals become capable of performing these roles in the first place? Direct selling offers a particularly revealing context for examining this question because it organizes market activity through interpersonal interaction, demonstration, explanation, and relationship-based exchange (Biggart, 1989; Peterson & Wotruba, 1996). In 2024, U.S. direct selling generated $34.7 billion in retail sales and included 12.2 million individuals who have signed or renewed independent contractor agreements with direct selling companies. Of these, 5.4 million were direct sellers actively working to build businesses, while 6.8 million were discount buyers who purchased products for personal use rather than business building. The channel also reached 34.3 million preferred customers and discount buyers, according to DSA/DSEF reporting (Direct Selling Education Foundation, 2025). These figures highlight direct selling as an important setting for understanding how individuals enter and perform market participation.

What distinguishes this context is the central role of materials — catalogs, training guides, demonstration formats, recommendation tools, and ordering systems — that shape how individuals engage with products and with one another. These materials do more than communicate product attributes; they model how individuals act. They show how to use products, demonstrate value, interact with others, interpret needs, and facilitate exchange (Orlikowski, 2000; Shove et al., 2012). Across firms, these materials emphasize different aspects of participation. Tupperware and Pampered Chef foreground demonstration and group-based interaction; Mary Kay and Avon emphasize advisory roles grounded in consultation and recommendation; Herbalife and Nu Skin center engagement on diagnostic routines that align products with identified needs. Other firms, including Arbonne, Young Living, and doTERRA combine demonstration, advising, and community-based engagement in varying ways. These patterns suggest that diverse participation across direct selling firms reflects different emphases within a broader participation system (Biggart, 1989; Peterson & Wotruba, 1996; Weitz et al., 2020).

The contemporary relevance of this issue is especially visible in Generation Z market participation. Gen Z consumers routinely encounter products through creator content, peer recommendations, digital communities, livestream demonstrations, and platform-enabled shopping environments (Elshaer et al., 2024). In these settings, product value is often made visible through short-form video, interpreted through peer or influencer commentary, and converted into purchase through embedded links, storefronts, and checkout tools (Djafarova & Bowes, 2021; Ki et al., 2020; Lou & Yuan, 2019). These activities are often treated as novel features of platform economies, where digital infrastructures scale interaction, exchange, and ecosystem participation (Nambisan et al., 2019). Yet they also resemble long-standing participation roles: demonstrating products, advising others, hosting interaction, and facilitating transactions. Gen Z therefore makes the paper’s central puzzle more visible: if contemporary consumers appear increasingly capable of participating in markets, how are those participation capabilities learned, structured, and coordinated?

This question connects to the broader concept of prosumption, in which individuals participate in the creation, communication, and exchange of value (Toffler, 1980; Ritzer & Jurgenson, 2010). Existing research documents what prosumers do — how they create content, share knowledge, shape meanings, and contribute to value — but offers limited insight into how individuals become capable of doing so (Schau et al., 2009). This limitation matters because participation does not simply appear when markets become more social, digital, or decentralized. Individuals must learn how to demonstrate, advise, interact, and facilitate exchange in ways that are recognizable to others. Gen Z’s digital participation is therefore not treated here as a separate phenomenon, but as a contemporary expression of a broader question about how market participation is formed.

This study addresses that gap by examining Amway advertisements from 1970 to 2001. The analysis shows that participation is not left to individual interpretation but is structured through recurring practices — use, diagnose, demonstrate, interact, and advise — that are made observable and repeatable. These practices provide the foundation through which individuals learn how to engage with products and with others. The findings further show that these practices stabilize into recognizable roles — caretaker, diagnostician, demonstrator, host, advisor, and facilitator — that organize participation across contexts. In this sense, Amway is not treated as a representative direct selling firm, but as an integrative context in which roles that are often emphasized separately across different selling companies become visible within a single participation system. Here, “separately” does not refer to traditional retail structures, but to variation within the direct selling field itself. Some firms organize participation primarily around demonstration and hosting, others around consultation and advising, and still others around diagnosis, product routines, or community-based engagement. Amway is analytically useful because its materials bring these role elements together and show how they can be coordinated within one participation system.

The analysis also shows that market exchange is not driven by isolated behaviors but emerges from the coordination of these roles. Within Amway, materials explicitly link demonstration, diagnosis, advising, and facilitation into sequences of engagement that guide participants from initial interaction to completed transactions. Demonstration scripts make product value visible, needs-assessment prompts guide diagnosis, bundle recommendation sheets support advising, and order coordination tools translate interest into exchange. This sequencing helps explain why contemporary Gen Z participation should not be understood only as platform-driven novelty. Digital platforms may change the medium, speed, and visibility of participation, but the underlying role structure — demonstrating, advising, hosting, and facilitating — reflects a longer-standing participation logic.

This study contributes to research on prosumption by shifting attention from participation as an outcome to participation as a process of formation. Rather than asking only what prosumers do, it explains how individuals become capable of performing prosumption activities through structured materials, repeated practices, and recognizable roles. It also contributes to direct selling research by reframing direct selling as a participation system rather than merely a distribution channel or sales format. Finally, by showing how Amway integrates participation roles emphasized separately across different selling companies, the study provides a process-based account of how participation capabilities are structured, learned, and coordinated into market exchange.

Conceptual Background

Direct Selling as a Participation System

Direct selling encompasses a diverse set of organizational models that structure participation in different ways. Rather than representing a single approach to market exchange, the field consists of firms that promote different forms of engagement. Some organizations center participation around demonstration and shared experience. Tupperware and Pampered Chef, for example, organize interaction through group settings in which products are presented, tested, and discussed collectively. Other firms emphasize advisory relationships. Mary Kay and Avon position participants as guides in product selection and use, making consultation and recommendation central to participation. A third set of firms extends participation into diagnostic and system-based guidance. Herbalife and Nu Skin structure engagement around identifying needs and connecting those needs to product systems, while firms such as Arbonne, Young Living, and doTERRA combine demonstration, advising, routines, and community-based engagement in varying ways. These differences reflect direct selling’s broader reliance on interpersonal exchange, demonstration, and relationship-based selling (Biggart, 1989; Peterson & Wotruba, 1996; Weitz et al., 2020).

Historically, direct selling depended on materials that shape how participation occurs. Catalogs, training guides, demonstration formats, recommendation sheets, and ordering systems do not merely support exchange; they organize it. They show participants how to use products, explain them, interact with others, and move from interest to transaction. In this sense, direct selling materials function as practical guides for participation, making market activity observable, repeatable, and learnable (Biggart, 1989; Peterson & Wotruba, 1996). This matters because participation is not evenly distributed across direct selling firms. Different organizations emphasize particular roles within a broader system. Demonstration, advising, diagnosis, hosting, and facilitation may appear separately across firms, but together they point to a larger structure through which individuals are taught to participate in markets. Understanding that structure requires moving beyond firm-level descriptions to examine how participation is formed.

Prosumption, Platforms, and the Formation of Participation

The forms of engagement visible in direct selling align with the broader concept of prosumption, in which production and consumption become intertwined (Toffler, 1980; Ritzer & Jurgenson, 2010). Prosumers do not simply consume value; they contribute to its creation, communication, and circulation. Prior research has documented these activities in contexts such as brand communities, co-creation settings, digital platforms, and peer-to-peer exchange, showing how consumers generate content, advise others, shape meanings, and participate in value creation (Cova & Dalli, 2009; Humphreys & Grayson, 2008; Schau et al., 2009). Yet this literature often treats participation as already available, emphasizing what consumers do more than how participation capabilities are formed (Cova & Dalli, 2009; Schau et al., 2009). The ability to demonstrate products, interpret needs, guide others, and facilitate exchange is often assumed rather than explained. This limitation is central to the paper’s argument because participation requires more than access to markets or technologies; it requires learned practices, recognizable roles, and structured forms of interaction.

This issue is especially visible in contemporary platform economies, where markets increasingly rely on users, creators, influencers, and peer participants who perform market-facing roles at scale. Platformization reshapes consumer culture by reorganizing interaction, mediation, visibility, and market participation (Caliandro et al., 2024). Product value is demonstrated through short-form videos, livestreams, reviews, and tutorials; needs are interpreted through creator commentary, peer discussion, and recommendation systems; interaction is organized through digital communities and platform-mediated audiences; and exchange is facilitated through embedded links, affiliate storefronts, shoppable posts, and checkout tools (Busalim et al., 2021). Generation Z makes this process particularly visible because Gen Z consumers frequently encounter products through creator content, peer recommendations, social commerce interfaces, and platform-mediated communities (Djafarova & Bowes, 2021; Ki et al., 2020; Lou & Yuan, 2019). These behaviors are often described as features of digital platforms or influencer economies, but they also depend on recognizable participation roles: demonstrating, advising, hosting, and facilitating.

The platform economy therefore sharpens the theoretical problem. Platforms expand the visibility, speed, and reach of participation, but they do not by themselves explain how individuals learn to perform market-facing roles (Nambisan et al., 2019; Scaraboto & Fischer, 2024). A platform may provide the infrastructure for content creation, recommendation, interaction, and transaction, but participation still requires capabilities that must be learned and recognized by others. This creates a bridge between direct selling and platform-mediated markets: both rely on participants who connect products, audiences, recommendations, and exchange. The difference is that direct selling materials make the formation of those roles more observable, while platforms amplify their circulation.

Practice theory offers a way to examine this formation process. Practices are routinized patterns of activity shaped by the relationship among materials, competencies, and meanings (Reckwitz, 2002; Shove et al., 2012). From this perspective, participation is not simply an expression of individual preference or motivation. It is learned through repeated engagement with materials and situations that make action possible. Materials matter because they provide cues, scripts, and formats that make practices visible and performable (Orlikowski, 2000; Warde, 2005). In direct selling, materials such as catalogs, demonstration guides, recommendation sheets, and ordering tools provide precisely this kind of structure. They do not only describe products; they show participants how to perform market-facing activities. Through repeated exposure to these materials, individuals learn how to use, diagnose, demonstrate, interact, advise, and facilitate exchange. Over time, these practices become more stable and recognizable.

This reframes prosumption as a process of formation. Rather than asking only what prosumers do, the central issue becomes how participation capabilities are developed. Direct selling provides a useful context for this question because it makes the formation process visible in organizational materials that explicitly guide action. Gen Z and platform-mediated participation, by contrast, show the contemporary expression of the same underlying issue: participation appears widespread, but it still depends on learned practices, recognizable roles, and coordinated forms of interaction.

From Distributed Roles to an Integrative System

Practice theory explains how participation is learned, but it does not fully explain how repeated activities become organized into recognizable forms of engagement. Role theory provides a complementary lens. Roles are patterned forms of behavior that guide interaction and allow others to understand what kind of participation is being performed (Biddle, 1986; Goffman, 2023). In market contexts, roles such as demonstrator, advisor, host, or facilitator organize how individuals engage with products, customers, audiences, and one another. In direct selling, these roles appear to be distributed across firms, reflecting variation in demonstration, advising, diagnostic engagement, and relationship-based selling practices (Biggart, 1989; Peterson & Wotruba, 1996). One firm may foreground the demonstrator role through product presentations, another may foreground the advisor role through consultation, and another may emphasize diagnostic engagement through product systems and needs assessment. These patterns suggest that direct selling firms do not simply differ in product categories or sales formats; they emphasize different role configurations within a broader participation system.

The central analytical challenge is to observe how these roles operate together. If roles are distributed across firms, it is difficult to see how they interact within a single participation system. This is where Amway becomes analytically useful. Amway’s materials span multiple domains — household products, personal care, beauty, wellness, product systems, recommendations, and ordering tools. This breadth makes it possible to observe how practices associated with use, diagnosis, demonstration, advising, interaction, and facilitation co-occur within one organizational context. Amway is therefore not treated here as a typical or representative direct selling firm. It is treated as an integrative empirical lens. Its materials make visible how roles that are often distributed across firms can be linked within a single participation system. This distinction is important because the study is not simply about identifying roles, but about explaining how practices stabilize into roles and how those roles coordinate participation toward exchange.

This role-based perspective also clarifies how the study connects historical direct selling materials to contemporary platform participation. The argument is not that Amway predicts Gen Z behavior or that direct selling and platform economies are identical. Rather, Amway provides an archival setting in which the formation of participation roles can be observed in detail. Platform economies show why this formation process matters today: digital markets depend on participants who can demonstrate, advise, host, and facilitate exchange across technologically mediated settings. Amway is relevant not because it is a simple precursor to platforms, but because it reveals the underlying role logic that platform environments now scale, accelerate, and reconfigure.

Methods

Research Design

This study uses a qualitative, interpretive research design to examine how participation is constructed through materials that guide action and interaction. The purpose is not simply to document direct selling practices, but to explain how individuals become capable of performing prosumption activities. This design is appropriate because the study focuses on processes of learning, repetition, stabilization, and coordination — processes that are difficult to capture through outcome-based measures alone (Gioia et al., 2013; Langley, 1999).

Amway is used as an integrative empirical lens. As developed in the conceptual background, direct selling firms often emphasize particular forms of participation, such as demonstration, advising, diagnosis, hosting, or facilitation. Amway is analytically useful because its materials span multiple domains, including household products, personal care, beauty, wellness, product systems, recommendation tools, and ordering materials. This breadth makes it possible to observe how practices that are often distributed across firms co-occur and become linked within a single participation system. The study therefore treats Amway not as a representative case, but as a context in which the structure of participation becomes visible.

Data Collection

The empirical analysis draws on a curated set of 27 archival artifacts produced by Amway between 1970 and 2001. These artifacts include catalogs, training guides, demonstration formats, recommendation tools, and ordering materials. The period is useful because it captures the development of direct selling materials across product use, interaction, advising, and transaction facilitation. Rather than focusing only on promotional content, the dataset includes materials that guide what participants are expected to do and how they are expected to engage with others.

Artifacts were selected because they contained explicit or implicit guidance on participation. Some materials modeled routine product use, while others showed how to demonstrate products, assess needs, recommend product combinations, host interaction, or coordinate orders. This selection strategy supports the study’s central aim: to examine how participation is structured through materials rather than assumed as an individual trait.

Table 1 summarizes the artifact categories used in the analysis. The table is included here because the credibility of the study depends on showing the range of materials analyzed before presenting the coding and findings. Together, the artifacts provide a longitudinal view of how participation was modeled across product use, interpersonal interaction, role formation, and exchange.

Table 1
Overview of Amway Archival Artifacts Analyzed (1970-2001)

Artifact
Category
Description Participation Function
in the Analysis
Illustrative Artifacts Period Covered
Product catalogs and product system materials Catalogs and product-oriented materials presenting household, personal care, beauty, wellness, and related product systems Model routine product use and provide the foundation for the use practice and caretaker role Household cleaning routines catalog; extended product system guides; usage manuals 1970s–2001
Training and needs-assessment materials Materials that guide participants in identifying customer needs, asking questions, and interpreting situations Support the diagnose practice and diagnostician role by showing participants how to assess needs before recommending products Customer needs assessment guide; diagnostic training frameworks 1990s–2001
Demonstration materials and presentation scripts Materials that show participants how to present product features, sequence demonstrations, and make product value visible Support the demonstrate practice and demonstrator role by scripting visible product performance Kitchen product demonstration script; advanced demonstration guides 1980s–2001
Hosting and interaction guides Materials that structure group engagement, invitations, discussion, and shared product experiences Support the interact practice and host role by organizing social participation around products Hosted demonstration event guide; group engagement materials 1980s–2001
Recommendation and product-bundle tools Materials that connect identified needs to product combinations, routines, or solution sets Support the advise practice and advisor role by guiding product choice and recommendation Product bundle recommendation sheet; expanded recommendation frameworks 1990s–2001
Ordering and transaction-
coordination materials
Forms and tools that guide order placement, coordination, fulfillment, and transaction completion Support the facilitator role by connecting interaction and recommendation to exchange Order coordination and fulfillment form; later ordering tools 1990s–2001


Coding Procedure

The coding procedure moved from concrete material evidence to broader conceptual categories. The first stage focused on observable actions within the artifacts. These included actions such as using products, presenting product features, asking questions, identifying needs, recommending product combinations, inviting interaction, and coordinating orders. At this stage, the goal was to capture what the materials asked participants to do before interpreting those actions as broader practices or roles. The second stage grouped recurring actions into broader practice categories. Actions related to routine product application were grouped under use. Actions involving need identification were grouped under diagnose. Product presentation actions were grouped under demonstrate, while conversation, hosting, and group engagement actions were grouped under interact. Recommendation-oriented actions were grouped under advise. These practice categories reflect repeated forms of engagement that participants could observe, copy, and refine. The third stage examined how practices stabilized into recognizable roles. Repeated practices of routine use supported the caretaker role. Need-identification practices supported the diagnostician role. Presentation practices supported the demonstrator role. Group engagement practices supported the host role. Recommendation practices supported the advisor role. Transaction-coordination practices supported the facilitator role. This coding progression allowed the analysis to move from materials to practices, from practices to roles, and from roles to exchange, consistent with qualitative approaches that develop concepts through iterative abstraction from empirical evidence (Gioia et al., 2013).

Detailed artifact-level coding examples are provided in Appendix A, which links specific artifacts to coded actions, practice categories, and roles. Appendix B provides coding definitions and inclusion criteria. These appendices make the analytical movement from artifact evidence to conceptual interpretation visible while keeping the main text focused on the core analysis.

Analytical Approach

The analysis was iterative rather than strictly linear. Codes were refined through repeated movement between individual artifacts, emerging categories, and the broader conceptual framework. This movement between data and emerging interpretation is consistent with process-oriented qualitative analysis, where concepts are developed through comparison over time and across evidence (Langley, 1999). The purpose of this iterative process was not only to identify recurring practices, but to understand how those practices became linked into roles and coordinated toward exchange.

Three analytical moves were especially important. First, the analysis compared practices across different artifact types to determine whether they appeared consistently or only within isolated materials. Catalogs, training guides, demonstration formats, recommendation tools, and ordering materials each modeled different aspects of participation. Examining them together made it possible to trace how product use, demonstration, advising, interaction, and transaction facilitation were connected across the broader participation system.

Second, the analysis refined the boundaries between adjacent practices and roles. Some categories initially appeared close to one another. Demonstration and advising, for example, both involved communicating product value. They were separated analytically because demonstration makes value visible through performance, whereas advising interprets needs and guides product choice. Similarly, interaction and facilitation were distinguished because interaction organizes engagement, while facilitation operationalizes exchange. These distinctions were central to explaining how participation roles coordinate without collapsing into a single generalized selling activity.

Third, the analysis examined whether patterns were reinforced across the full corpus rather than concentrated in a few illustrative artifacts. Primary artifacts are used in the results to make each practice and role concrete, while later artifacts show how these patterns recur across the dataset. This corpus-level comparison supports the interpretation that the findings reflect a structured participation system rather than isolated examples. Appendix A provides artifact-level coding examples, and Appendix B provides coding definitions and inclusion criteria, making the movement from material evidence to conceptual interpretation visible.

Results

The results trace how participation is constructed through a cumulative process: materials model practices, practices stabilize into roles, and roles coordinate market exchange. This progression corresponds to the study’s central empirical logic. First, the analysis shows how direct selling materials structure participation practices. Second, it shows how those practices become recognizable roles. Third, it shows how roles work together to enable exchange. Rather than treating participation as an outcome, the findings show how it is formed through structured engagement. Materials make participation visible; repeated practices make it performable; roles make it recognizable; and the coordination of roles makes exchange possible, consistent with practice-based perspectives on how action becomes routinized and socially shared (Reckwitz, 2002; Shove et al., 2012).

Participation Practices

Participation first appears in the materials as a set of concrete, repeatable activities. Individuals are not simply presented with products; they are shown how to act — how to use products, demonstrate their value, engage others, interpret needs, and provide recommendations. These actions recur across materials and converge into five core practices: use, diagnose, demonstrate, interact, and advise.

The use practice is most visible in early catalog materials. A household cleaning product catalog from the 1970s presents products within structured routines — daily, weekly, and situational applications — implicitly guiding participants to integrate products into ongoing patterns of use (A1). Rather than framing consumption as a one-time act, the catalog normalizes repeated engagement. This reflects how practices are sustained through repetition and embedded in everyday routines (Warde, 2005). This emphasis on continuity is reinforced in later product system guides and extended usage manuals (A9–A12).

The diagnose practice emerges in training-oriented materials. A customer needs assessment guide includes prompts that encourage participants to identify problems before recommending products (A5). This shifts engagement from product presentation to situational interpretation. Later materials expand these diagnostic routines into structured frameworks, reinforcing the participant’s role as an evaluator of needs rather than a passive presenter of products (A13–A16).

The demonstrate practice is explicitly structured in product demonstration materials. A kitchen product demonstration script provides step-by-step guidance on how to present features in sequence, ensuring that performance becomes visible and observable (A3). Demonstration operates as a performative practice that makes product value tangible, consistent with research on how consumer practices generate shared meaning (Schau et al., 2009). This scripting is echoed in more advanced demonstration guides (A10–A14).

The interact practice appears in materials that organize group participation. A hosted demonstration event guide outlines how to invite participants, facilitate discussion, and structure shared experiences (A4). Interaction is therefore not incidental but designed into participation, reflecting how engagement is socially organized (Cova & Dalli, 2009). These patterns are reinforced in later materials that formalize engagement strategies and group interaction (A11–A15).

The advise practice appears in recommendation-oriented materials. A product bundle recommendation sheet presents combinations of products tailored to specific needs, guiding participants to frame choices around situations rather than isolated features (A7). Later frameworks extend these bundles into more complex systems of recommendation, reinforcing advising as an interpretive practice through which participants connect needs to product combinations (A14–A18).

Across these examples, participation is made learnable. The materials repeatedly encode actions that can be observed, copied, and refined. Appendix A shows how these practices recur across the full set of artifacts (A1–A27). Participation is therefore not assumed; it is constructed through structured exposure to practices (Reckwitz, 2002; Shove et al., 2012). These practices are not unique to one firm. Demonstration, advising, diagnosis, hosting, and facilitation are visible across the direct selling field, but different firms tend to foreground different practices. Tupperware and Pampered Chef make demonstration and hosting especially visible; Mary Kay and Avon foreground advising; Herbalife and Nu Skin emphasize diagnostic engagement through product systems; and firms such as, Arbonne, Young Living, and doTERRA combine advising, routines, and community-based engagement in varying ways. What distinguishes the Amway materials examined here is that these practices are observed together and linked within a single artifact system. Demonstration scripts connect to need-identification prompts, recommendation sheets translate needs into product bundles, and ordering tools convert recommendations into completed transactions (A3, A5, A7, A8). This linkage provides the bridge from individual practices to participation roles.

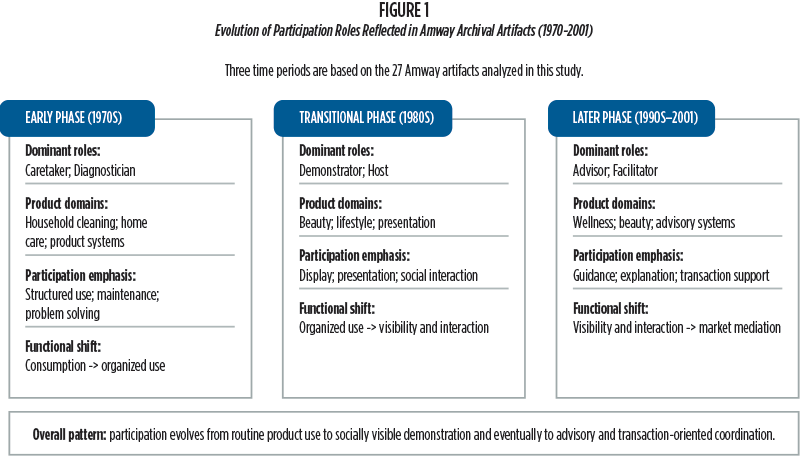
Figure 1 captures this cumulative process. Practices begin as modeled activities, but through repetition and combination they become stable forms of participation. Individuals move from routine engagement to more complex forms involving diagnosis, demonstration, interaction, and advising. The figure therefore shows how participation develops through structured exposure rather than spontaneous adoption.

Role Formation

As practices accumulate and interact, they stabilize into recognizable forms that organize participation. Across firms, these forms often appear as distinct modes of engagement. In Amway’s materials, however, they appear as interconnected roles within a broader participation system. The analysis identifies six such roles: caretaker, diagnostician, demonstrator, host, advisor, and facilitator. These roles reflect patterned forms of social action that guide interaction and make participation recognizable to others (Biddle, 1986; Goffman, 2023).

The caretaker role is grounded in routine use. In the household cleaning routines catalog, products are embedded within repeated applications, positioning participants as stewards of ongoing product engagement rather than one-time consumers (A1). This role is reinforced in extended usage materials that emphasize continuity across product systems (A9–A12).

The diagnostician role builds on need-identification practices. The customer needs assessment guide positions participants as evaluators who interpret situations before recommending products (A5). Later diagnostic frameworks elaborate this role by formalizing how participants identify needs and connect them to product systems (A13–A16).

The demonstrator role emerges from structured presentation. The kitchen product demonstration script specifies how participants should present product features in sequence, making product value visible through performance (A3). Demonstration therefore becomes a repeatable role rather than an improvised activity. Additional demonstration materials reinforce this role by standardizing presentation techniques across settings (A10–A14).

The host role is evident in materials that organize interaction. The hosted demonstration event guide provides instructions on structuring group engagement, inviting participation, and facilitating discussion (A4). Hosting organizes the social conditions in which demonstration, interaction, and advising can occur. Later materials extend this logic into broader engagement strategies (A11–A15).

The advisor role extends recommendation practices. The product bundle recommendation sheet aligns products with identified needs, guiding participants to support decision-making (A7). The advisor role therefore depends on interpretation and judgment, not merely product knowledge. Later recommendation materials expand this advisory logic into more comprehensive solution frameworks (A14–A18).

The facilitator role becomes visible in transaction-oriented materials. An order coordination and fulfillment form structures how product selections are translated into completed transactions, including ordering, coordination, and delivery processes (A8). This role connects participation to exchange by operationalizing the transaction itself. Later ordering and coordination tools further systematize this role across the dataset (A15–A27).

While each role is anchored in specific materials, the broader corpus shows that these roles are repeatedly reinforced across artifact types. Roles therefore emerge not as isolated categories but as stabilized configurations of practice shaped through repeated exposure and coordination (Reckwitz, 2002).

Figure 2 illustrates how these roles form an interconnected system. Demonstration supports advising because visible product performance provides the basis for recommendation. Interaction enables hosting because participation often requires a social setting. Facilitation connects these activities to exchange by providing the mechanisms through which transactions are completed. Participation therefore emerges through coordination among roles rather than through isolated actions (Shove et al., 2012).
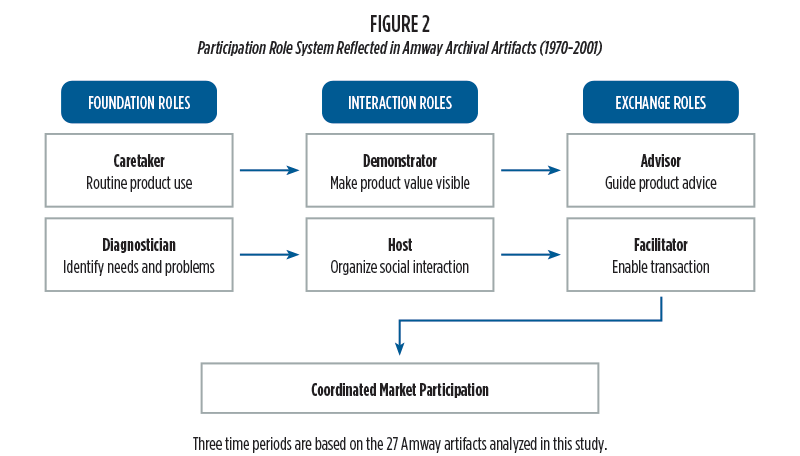

Table 2 places the role system in comparative context. The table is not intended to classify firms as mutually exclusive role types. Rather, it shows how different direct selling firms make particular participation roles especially visible. Tupperware and Pampered Chef foreground demonstration and hosting because their models organize participation around group-based product presentation. Mary Kay and Avon make advising especially visible through consultation and personalized recommendation. Herbalife and Nu Skin foreground diagnostic engagement by linking needs assessment to product systems. Firms such as, Arbonne, Young Living, and doTERRA combine elements of advising, routines, community interaction, and product-system guidance. These examples indicate that participation roles are distributed across the direct selling field, reflecting variation in how firms structure interpersonal exchange and relationship-based selling (Biggart, 1989; Peterson & Wotruba, 1996).

Table 2
Participation Roles Across Firms and Contemporary Contexts

Participation Role Core Function Role Manifestation in Comparative Firms Amway’s Integrative Coverage Contemporary Digital/Platform Expression
Caretaker Maintains routine product use and embeds products in everyday practices Often implicit across product-based direct selling firms where repeated use, replenishment, and routines are central Product catalogs and usage materials frame products as part of ongoing household, personal care, beauty, and wellness routines Routine-sharing content; “daily use” videos; product routine posts; recurring subscription or replenishment practices
Diagnostician Identifies needs, problems, or situations that products may address Herbalife and Nu Skin make diagnostic engagement especially visible through needs-based and product-system guidance; Rodan + Fields and Arbonne also show routine/system-based diagnosis Needs-assessment materials guide participants to interpret situations before recommending products across multiple product domains Problem-solution content; personalized recommendation quizzes; diagnostic influencer content; needs-based peer advice
Demonstrator Makes product value visible through presentation or performance Tupperware and Pampered Chef make demonstration especially visible through product parties, cooking demonstrations, and hosted product experiences Demonstration scripts show participants how to sequence product presentations and make benefits observable across product categories Product tutorials; reviews; short-form demonstration videos; livestream product showcases
Host Organizes social interaction around products Tupperware and Pampered Chef strongly manifest hosting through parties, gatherings, and shared product experiences; Young Living and doTERRA also show community-based engagement Hosted demonstration guides structure invitations, group discussion, and shared engagement Livestream hosts; online community moderators; group chats; social commerce events
Advisor Guides interpretation, product choice, and recommendation Mary Kay and Avon make advising especially visible through consultation, personalized recommendation, and relational guidance; Rodan + Fields and Arbonne also emphasize routine-based advising Bundle recommendation materials connect identified needs to product combinations and solution sets Influencer recommendations; peer advising; “best for you” content; creator-curated product lists
Facilitator Coordinates access, ordering, fulfillment, and transaction completion Present across direct selling firms but often backgrounded as transaction support rather than foregrounded as a participation role Ordering and coordination tools link interaction and recommendation to completed exchange, making facilitation visible as part of the role system Embedded checkout links; affiliate storefronts; shoppable posts; platform-based transaction tools

Amway is analytically useful because its materials provide the most comprehensive view of this distributed role system within a single organizational context. The Amway artifacts do not simply show isolated practices; they connect routine use, diagnosis, demonstration, interaction, advising, and facilitation into linked sequences of engagement. This breadth makes Amway especially useful for examining how participation roles operate together rather than separately. Amway is therefore distinct not because it is superior to other firms, but because its materials make role integration visible. In many firms, participation is organized around a dominant mode of engagement. In Amway’s materials, roles are linked: demonstration connects to advising, advising connects to product systems, and interaction connects to facilitation (A3, A7, A8). This structure allows participants to move across roles within a coordinated system rather than remain within one dominant form of engagement. This distinction is central to the findings. Amway does not merely display a broader role set; it organizes roles relationally. Its materials show how use, diagnosis, demonstration, advising, interaction, and facilitation can reinforce one another. In this sense, Amway functions as an integrative empirical lens through which a distributed participation system becomes visible within a single organizational context.

Participation and Market Exchange

The final pattern concerns how participation extends into market exchange. Exchange does not appear as a single act or as the result of isolated persuasion. It emerges from the coordination of roles.

Material evidence shows how this coordination operates. Demonstration scripts make product value visible (A3), needs-assessment prompts frame problems and guide diagnosis (A5), recommendation materials support interpretation and product matching (A7), and transaction tools operationalize exchange (A8). Later artifacts further systematize this process by linking interaction, advising, and ordering into coordinated sequences (A15–A27).

This coordination matters because exchange requires more than awareness. Product value must be made visible, needs must be interpreted, trust must be established, and transactions must be completed. The role system performs these functions collectively. Demonstration makes value observable. Advising makes value meaningful. Hosting creates a setting for interaction. Facilitation converts interest into exchange. Market exchange is therefore produced through role alignment rather than isolated behavior, consistent with prosumption perspectives that view value as emerging through multiple forms of participation (Ritzer & Jurgenson, 2010).

Table 3 shows how this role system develops over time. Early materials emphasize routine use and maintenance, as seen in household product catalogs that embed products in repeated domestic routines (A1). Transitional materials increasingly incorporate demonstration and interaction, as seen in scripted demonstration and hosted event guides (A3, A4). Later materials integrate advising and facilitation, as seen in bundle recommendation sheets and order coordination tools (A7, A8). Over time, participation becomes more coordinated, reflecting the emergence of a role-based system.

Table 3
Evolution of Participation Roles Reflected in Amway Archival Artifacts (1970-2001)

Period Primary Material Emphasis Dominant Practices Dominant Roles Participation Pattern Representative Artifact Evidence
Early phase:
1970s
Product use, household routines, and maintenance Use;
early diagnosis
Caretaker; emerging diagnostician Participation is organized around routine product use and problem solving. Materials teach participants how to incorporate products into repeated domestic and household practices. Household cleaning routines catalog (A1); early product system and usage materials (A9, A9, A12)
Transitional
phase:
1980s
Demonstration, presentation, and group interaction Demonstrate;
interact
Demonstrator; host Participation expands from routine use to socially visible product presentation. Materials show participants how to make product value observable and how to organize interaction around products. Kitchen product demonstration script (A3); hosted demonstration event guide (A4); advanced demonstration and group engagement materials (A10–A14)
Later phase:
1990s–2001
Advising, product systems, recommendation, and transaction coordination Advise; facilitate; advanced diagnosis Advisor; facilitator; reinforced diagnostician Participation becomes more coordinated and exchange-oriented. Materials link needs assessment, product recommendation, and ordering into sequences that move participants from interaction to completed exchange. Customer needs assessment guide (A5); product bundle recommendation sheet (A7); order coordination and fulfillment form (A8); later ordering and coordination tools (A15–A27)

This progression is cumulative rather than substitutive. Later roles build on earlier ones rather than replacing them. Advising depends on product familiarity; demonstration depends on use; facilitation depends on interaction and trust. Direct selling materials first stabilize practices of use, then expand participation through demonstration and interaction, and eventually link those roles to advising and exchange. This pattern aligns with practice-based accounts of how repeated activities evolve into organized systems of action (Reckwitz, 2002; Shove et al., 2012).

In summary, these findings show that market exchange is produced through structured participation systems that connect practices, roles, and interaction. Contemporary forms of participation — such as digital content creation, peer advising, and platform-based transactions — reflect this same underlying structure, even as the contexts in which roles are performed have changed (Djafarova & Bowes, 2021; Ki et al., 2020; Lou & Yuan, 2019).

Discussion

This study examined how individuals become capable of participating in market processes commonly associated with prosumption. Rather than treating participation as an outcome of social, digital, or decentralized markets, the analysis shows how participation is formed through materials that model action, practices that become repeatable, and roles that coordinate exchange. The findings reposition prosumption as a process of formation: individuals become prosumers not simply because markets invite participation, but because participation capabilities are structured, learned, and organized.

Reframing Prosumption as a Formation Process

Prior research on prosumption has shown that consumers contribute to value creation through activities such as content generation, peer advising, product interpretation, and co-creation (Cova & Dalli, 2009; Ritzer & Jurgenson, 2010; Schau et al., 2009). This literature has been important in moving beyond passive models of consumption. However, it often begins after participation has already occurred. It documents what prosumers do but gives less attention to how individuals acquire the capability to perform these activities.

The present study addresses that gap by showing that participation capabilities are formed through structured exposure to participation practices. In the Amway materials analyzed here, individuals are shown how to use products, diagnose needs, demonstrate value, interact with others, and advise on product combinations. These practices are not left to improvisation; they are modeled through catalogs, training guides, demonstration formats, recommendation tools, and ordering systems. Through repetition, these practices become recognizable and transferable. Prosumption, in this account, is not simply an expression of consumer agency or co-created value; it is a learned capability developed through structured materials and repeated action. This distinction is important because recent work continues to examine how co-creation produces consumer and firm value, while the present study explains how the capability to participate in such value creation is formed (Sahi et al., 2022).

This reframing shifts the central question from “what do prosumers do?” to “how are prosumers made?” The answer developed in this study is that prosumers are formed through a participation system that links materials, practices, roles, and exchange. This process-based view helps explain why participation can appear natural in contemporary markets even though it depends on learned routines and structured forms of interaction.

Extending Practice and Role Perspectives

The findings extend practice theory by showing how practices become organized into participation roles. Practice theory emphasizes that action is shaped through recurring relationships among materials, competencies, and meanings (Reckwitz, 2002; Shove et al., 2012; Warde, 2005). The present study builds on this view but adds a further step: repeated practices do not remain isolated activities; they stabilize into roles that make participation recognizable to others.

The six roles identified in the analysis — caretaker, diagnostician, demonstrator, host, advisor, and facilitator — show how practices become socially organized. Routine use supports the caretaker role; needs assessment supports the diagnostician role; structured presentation supports the demonstrator role; group engagement supports the host role; recommendation supports the advisor role; and order coordination supports the facilitator role. These roles matter because they translate repeated practices into recognizable forms of market participation.

This finding also contributes to role theory. Role theory explains how patterned behavior guides interaction and allows participants to understand what is expected in social settings (Biddle, 1986; Goffman, 2023). In this study, roles are not treated as fixed positions assigned in advance. Instead, they emerge from repeated engagement with materials and practices. This connection between practice theory and role theory clarifies how learned action becomes organized and intelligible in market interaction.

Amway and the Integration of Distributed Participation Roles

A central insight of the study is that direct selling participation is distributed across firms but can be observed as an integrated system in Amway. Comparative examples show that firms tend to emphasize different aspects of participation. Tupperware and Pampered Chef make demonstration and hosting especially visible; Mary Kay and Avon foreground advising and relational guidance; Herbalife and Nu Skin emphasize diagnostic and system-based engagement; and firms such as, Arbonne, Young Living, and doTERRA combine advising, routines, community interaction, and product-system guidance in varying ways. These examples suggest that direct selling firms do not merely differ in product categories or selling formats. They emphasize different configurations of participation roles.

Amway is analytically useful because its materials provide a more comprehensive view of this distributed role system within a single organizational context. The findings show that Amway materials do not simply contain multiple roles; they link them. Demonstration scripts connect product performance to advising. Needs-assessment materials connect diagnosis to recommendation. Bundle recommendation sheets connect advising to product systems. Ordering tools connect interaction to transaction. This role integration is the mechanism that makes Amway useful as an empirical lens.

This distinction matters because it clarifies the contribution of the case. Amway is not presented as a typical direct selling firm or as a superior organizational model. Rather, it provides a context in which the broader participation system becomes visible. By bringing multiple roles into one coordinated sequence, Amway’s materials reveal how participation can move from product use to demonstration, from demonstration to advising, and from advising to exchange. The study therefore reframes direct selling as more than a distribution channel or sales method. It is a structured participation system that teaches individuals how to act in markets.

Implications for Platform Economies and Gen Z Participation

The findings also help reinterpret contemporary platform-based participation. Digital environments often make product demonstration, peer advising, community hosting, and transaction facilitation appear new. Influencers demonstrate products through short-form content and livestreams; peers advise one another through comments, reviews, and communities; and platform tools enable embedded transactions through links, storefronts, and checkout systems (Busalim et al., 2021; Djafarova & Bowes, 2021; Ki et al., 2020; Lou & Yuan, 2019). These activities are especially visible among Generation Z, whose consumption practices are closely intertwined with creator content, peer influence, and social commerce.

The present study suggests that these behaviors are not entirely new forms of participation. They are better understood as contemporary reconfigurations of roles that have long been structured in other market contexts. Digital platforms change the medium, scale, speed, and visibility of participation, but they do not eliminate the underlying role logic. Demonstration, advising, hosting, and facilitation remain central; they are enacted through different infrastructures.

This interpretation avoids treating Gen Z participation as a complete break from earlier market forms. Instead, Gen Z makes visible a broader shift in how participation roles are mediated. What appears distinctive about Gen Z participation is not necessarily the existence of demonstration, advising, hosting, or facilitation, but the way these roles are performed through platform infrastructures. Product demonstration occurs through short-form video and livestream formats; advising occurs through peer recommendations, creator commentary, and community discussion; hosting occurs through digital groups and platform-mediated audiences; and facilitation occurs through embedded links, storefronts, and checkout tools. In this sense, Gen Z participation reflects the platform-enabled reconfiguration of roles that have long organized market participation.

This connection also clarifies the relevance of Amway to the platform economy. The argument is not that Amway predicts platform behavior or that direct selling and platform economies are identical. Rather, Amway’s archival materials make the formation and integration of participation roles visible in a way that platform environments often obscure. Platforms amplify and accelerate participation, but Amway helps reveal how participation capabilities are structured in the first place. This interpretation complements recent work showing that platform markets are shaped by prosumer practices, not merely by platform infrastructures (Scaraboto & Fischer, 2024).

Managerial Implications

The findings have several practical implications for organizations that rely on participant engagement, peer recommendation, social selling, or platform-enabled commerce. First, participation should not be assumed. Organizations often expect individuals to create content, recommend products, engage communities, or facilitate transactions, but the findings suggest that these activities require structured support. Materials that model action — scripts, guides, examples, prompts, templates, and transaction tools — can help individuals learn how to participate effectively.

Second, firms should design for roles rather than isolated tasks. A participant who demonstrates a product may also need to diagnose needs, advise on fit, host interaction, and facilitate exchange. Treating these activities as disconnected tasks may weaken participation. Designing materials and tools around roles can help organizations support more coherent engagement.

Third, the findings highlight the importance of role integration. Many firms emphasize one dominant mode of participation, such as demonstration, advising, or community engagement. The Amway case suggests that participation becomes more powerful when roles are linked. A demonstration can lead into diagnosis; diagnosis can lead into advising; advising can lead into facilitation. Organizations seeking to strengthen participation should therefore consider how their materials guide individuals across linked forms of engagement rather than supporting each activity separately.

Finally, the findings are relevant for digital and platform-mediated settings. Platform features often encourage participation but do not necessarily teach users how to participate well. Firms can improve digital engagement by designing platform tools that support role transitions: from content viewing to product understanding, from peer discussion to recommendation, and from recommendation to transaction. This implication aligns with recent work on social selling, which shows that selling practices become established through participants’ practical work rather than through technology alone (Schmitt et al., 2021). In this sense, the study provides a role-based framework for designing participation in both direct selling and digital commerce contexts.

Limitations and Future Research

This study has several limitations that open opportunities for future research. First, the empirical analysis focuses on Amway materials from 1970 to 2001. This design is useful for observing role integration within one organizational context, but it does not allow for direct empirical comparison across all direct selling firms. Future research could compare multiple firms to examine whether and how different organizations structure participation roles in distinct ways.

Second, the study analyzes archival materials rather than direct participant behavior. The materials show how participation was formally modeled, scripted, and organized, but they do not show how individual participants interpreted or enacted those materials in practice. Future research could use interviews, ethnography, or observational methods to examine how participants actually move across roles in live selling contexts.

Third, the study connects the findings to contemporary digital participation conceptually rather than empirically. Future studies could examine whether the same role system appears in influencer marketing, social commerce, livestream selling, brand communities, or platform-enabled peer selling. Such research could test whether the roles identified here — demonstrator, host, advisor, facilitator, and related roles — operate similarly in digital environments.

Finally, future research could explore the conditions under which participation systems succeed or fail. The presence of materials and roles does not guarantee effective participation. Individual motivation, trust, social networks, product type, organizational incentives, and regulatory context may all shape whether participation roles are adopted and coordinated effectively.

Conclusion

This study explains how individuals become capable of participating in market processes commonly associated with prosumption. By examining Amway’s archival materials, the analysis shows how participation is structured through materials, learned through repeated practices, stabilized into roles, and coordinated into exchange. The central contribution is to shift attention from participation outcomes to participation formation. Prosumers are not simply produced by digital platforms, social markets, or decentralized exchange. They are formed through systems that teach individuals how to use, diagnose, demonstrate, interact, advise, and facilitate. By making this process visible, the study provides a framework for understanding how market participation is structured across direct selling, social commerce, and contemporary platform-mediated environments.


Note: The authors express sincere thanks to Amway for sharing their proprietary advertisements from the corporate archive for research purposes.


Dr. Jiyoon An is an Assistant Professor of Marketing at Fayetteville State University

Dr. Jae Hwan Lee is an Associate Professor of Business at Rollins College

REFERENCES

      • Biddle, B. J. (1986). Recent developments in role theory. Annual Review of Sociology, 12, 67–92.Biggart, N. W. (1989). Charismatic capitalism: Direct selling organizations in America. University of Chicago Press.Busalim, A. H., Ghabban, F., & Hussin, A. R. C. (2021). Customer engagement behaviour on social commerce platforms: An empirical study. Technology in Society, 64, Article 101437.
      • Caliandro, A., Gandini, A., Bainotti, L., & Anselmi, G. (2024). The platformization of consumer culture: A theoretical framework. Marketing Theory, 24(1), 3-21.
      • Cova, B., & Dalli, D. (2009). Working consumers: The next step in marketing theory? Marketing Theory, 9(3), 315–339.
      • Direct Selling Education Foundation. (2025). Impact of direct selling by state, 2024. https://www.dsa.org/docs/default-source/default/dsa-2025-statestatsfactsheet-updated.pdf. Retrieved on May 3, 2026.
      • Djafarova, E., & Bowes, T. (2021). ‘Instagram made Me buy it’: Generation Z impulse purchases in fashion industry. Journal of Retailing and Consumer Services, 59, Article 102345.
      • Elshaer, I. A., Alrawad, M., Lutfi, A., & Azazz, A. M. (2024). Social commerce and buying intention post COVID-19: Evidence from a hybrid approach based on SEM–fsQCA. Journal of Retailing and Consumer Services, 76, 103548.
      • Gioia, D. A., Corley, K. G., & Hamilton, A. L. (2013). Seeking qualitative rigor in inductive research: Notes on the Gioia methodology. Organizational Research Methods, 16(1), 15–31.
      • Goffman, E. (2023). The presentation of self in everyday life. In Social theory re-wired (pp. 450-459). Routledge.
      • Humphreys, A., & Grayson, K. (2008). The intersecting roles of consumer and producer: A critical perspective on co‐production, co‐creation and prosumption. Sociology compass, 2(3), 963-980.
      • Ki, C.-W. C., Cuevas, L. M., Chong, S. M., & Lim, H. (2020). Influencer marketing: Social media influencers as human brands attaching to followers and yielding positive marketing results. Journal of Retailing and Consumer Services, 55, Article 102133.
      • Langley, A. (1999). Strategies for theorizing from process data. Academy of Management Review, 24(4), 691–710.
      • Lou, C., & Yuan, S. (2019). Influencer marketing: How message value and credibility affect consumer trust of branded content on social media. Journal of Interactive Advertising, 19(1), 58–73.
      • Nambisan, S., Zahra, S. A., & Luo, Y. (2019). Global platforms and ecosystems: Implications for international business theories. Journal of International Business Studies, 50(9), 1464–1486.
      • Orlikowski, W. J. (2000). Using technology and constituting structures: A practice lens for studying technology in organizations. Organization Science, 11(4), 404–428.
      • Peterson, R. A., & Wotruba, T. R. (1996). What is direct selling? Definition, perspectives, and research agenda. Journal of Personal Selling & Sales Management, 16(4), 1–16.
      • Reckwitz, A. (2002). Toward a theory of social practices: A development in culturalist theorizing. European Journal of Social Theory, 5(2), 243–263.
      • Ritzer, G., & Jurgenson, N. (2010). Production, consumption, prosumption: The nature of capitalism in the age of the digital “prosumer.” Journal of Consumer Culture, 10(1), 13–36.
      • Sahi, G. K., Devi, R., Gupta, M. C., & Cheng, T. C. E. (2022). Assessing co-creation based competitive advantage through consumers’ need for differentiation. Journal of Retailing and Consumer Services, 66, 102911.
      • Scaraboto, D., & Fischer, E. (2024). Restless platformance: How prosumer practices change platform markets. Marketing Theory, 24(1), 45-63.
      • Schau, H. J., Muñiz, A. M., Jr., & Arnould, E. J. (2009). How brand community practices create value. Journal of Marketing, 73(5), 30–51.
      • Schmitt, L., Casenave, E., & Pallud, J. (2021). Salespeople’s work toward the institutionalization of social selling practices. Industrial Marketing Management, 96, 183-196.
      • Shove, E., Pantzar, M., & Watson, M. (2012). The dynamics of social practice: Everyday life and how it changes. SAGE Publications.
      • Toffler, A. (1980). The third wave. Bantam Books.
      • Warde, A. (2005). Consumption and theories of practice. Journal of Consumer Culture, 5(2), 131–153.
      • Weitz, B. A., Castleberry, S. B., & Tanner, J. F. (2020). Selling: Building partnerships (10th ed.). McGraw-Hill Education.

Appendix

Appendix A
Artifact-Level Coding and Illustrative Examples

Artifact ID Artifact/
Material Type
Period Illustrative Material Description Coded Actions Practice
Category
Participation
Role
A1 Household cleaning routines catalog 1970s Presents household products through repeated daily, weekly, and situational cleaning routines Use products repeatedly; maintain household routines; apply products to recurring problems Use Caretaker
A2 Early product collection/starter materials 1970s Introduces product collections and encourages participants to begin with bundled product sets Select starter products; organize initial product use; learn basic product categories Use/
Advise
Caretaker/
Advisor
A3 Kitchen product demonstration script 1980s Provides step-by-step guidance for presenting product features and making performance visible Present product features; sequence demonstration; show product value Demonstrate Demonstrator
A4 Hosted demonstration event guide 1980s Structures group participation through invitations, discussion, and shared product experiences Invite participants; organize group interaction; facilitate discussion Interact/
Demonstrate
Host/
Demonstrator
A5 Customer needs assessment guide 1990s Guides participants to identify customer needs before recommending products Ask questions; identify needs; interpret problems Diagnose Diagnostician
A6 Diagnostic training framework 1990s Expands needs assessment into structured product-system guidance Classify needs; connect problems to product categories; frame solutions Diagnose/
Advise
Diagnostician/
Advisor
A7 Product bundle recommendation sheet 1990s Connects identified needs to product combinations and solution sets Recommend bundles; match products to situations; guide product choice Advise Advisor
A8 Order coordination and fulfillment form 1990s–2001 Structures order placement, coordination, delivery, and transaction completion Record orders; coordinate fulfillment; complete transactions Facilitate Facilitator
A9 Extended product system guide 1970s–1980s Elaborates product use across multiple product categories and household routines Organize product use; connect products into systems; reinforce repeated application Use Caretaker
A10 Advanced demonstration guide 1980s Standardizes presentation techniques across product lines Present products; compare features; make benefits visible Demonstrate Demonstrator
A11 Group engagement material 1980s Provides guidance for structuring participant involvement in product settings Encourage discussion; invite participation; manage group engagement Interact Host
A12 Extended usage manual 1970s–1980s Provides additional instructions for repeated product application and maintenance Follow use routines; maintain product systems; repeat application Use Caretaker
A13 Needs-based training manual 1990s Formalizes needs identification and problem interpretation Ask diagnostic questions; identify concerns; classify needs Diagnose Diagnostician
A14 Product presentation and recommendation framework 1990s Links demonstration techniques with recommendation guidance Demonstrate product value; recommend product fit; explain benefits Demonstrate/
Advise
Demonstrator/
Advisor
A15 Interaction and ordering guide 1990s Connects participant interaction to ordering processes Engage participants; answer questions; coordinate order steps Interact/
Facilitate
Host/
Facilitator
A16 Product-system assessment guide 1990s Provides structured approach to matching product systems with identified needs Assess needs; align products; recommend systems Diagnose/
Advise
Diagnostician/
Advisor
A17 Expanded recommendation framework 1990s Extends product recommendation into broader solution sets Recommend combinations; explain product fit; guide decisions Advise Advisor
A18 Solution-oriented product guide 1990s Frames products as solutions to recurring needs or usage contexts Interpret situations; recommend solutions; connect products Diagnose/
Advise
Diagnostician/
Advisor
A19 Ordering system instruction sheet 1990s Explains ordering procedures and participant responsibilities in coordinating transactions Place orders; verify selections; coordinate purchase process Facilitate Facilitator
A20 Product access and fulfillment material 1990s Provides guidance on product availability, access, and fulfillment Manage access; coordinate delivery; support transaction completion Facilitate Facilitator
A21 Customer follow-up guide 1990s Guides post-interaction communication and continued engagement Follow up; answer questions; reinforce use and satisfaction Interact/
Advise
Host/
Advisor
A22 Product routine planning tool 1990s Helps participants organize recurring use around routines or product systems Plan routines; maintain product use; reinforce consistency Use Caretaker
A23 Advisory script/consultation guide 1990s Provides language for guiding product choice through consultation Interpret needs; recommend options; guide choice Advise Advisor
A24 Demonstration follow-up material 1990s Connects product demonstration to later interaction and recommendation Review demonstration; answer questions; recommend next steps Demonstrate/
Interact/
Advise
Demonstrator/
Host/
Advisor
A25 Transaction coordination checklist 1990s–2001 Provides steps for ensuring completion of orders and related coordination Confirm choices; coordinate orders; support fulfillment Facilitate Facilitator
A26 Integrated product system guide 2000–2001 Connects use, assessment, recommendation, and ordering into one participation sequence Use products; assess needs; recommend systems; coordinate exchange Use/
Diagnose/
Advise/
Facilitate
Caretaker/
Diagnostician/
Advisor/
Facilitator
A27 Later integrated participation guide 2000–2001 Brings together demonstration, interaction, advising, and ordering support Demonstrate; engage participants; recommend products; facilitate transaction Demonstrate/
Interact/
Advise/
Facilitate
Demonstrator/
Host/
Advisor/
Facilitator

Note: Artifact titles are descriptive labels used to identify the function of each material in the analysis. The table illustrates how individual artifacts were coded from observable actions to broader practice categories and participation roles. The coding supports the study’s analytical progression from materials to practices, from practices to roles, and from roles to coordinated market exchange.

Appendix B
Coding Definitions and Inclusion Criteria

Code/Practice Category Definition Inclusion Criteria Exclusion Criteria Illustrative Evidence from Artifacts Associated Participation Role(s)
Use Routine application of products in everyday contexts. Code when materials show repeated product application, household or personal care routines, maintenance practices, or ongoing product use. Do not code as use when the material only lists product attributes without showing how products are incorporated into routines. Household cleaning routines catalog; extended usage manuals; product routine planning tools. Caretaker
Diagnose Identification and interpretation of needs, problems, or situations that products may address. Code when materials guide participants to ask questions, identify needs, classify problems, or connect situations to product categories. Do not code as diagnose when materials simply describe product benefits without requiring interpretation of user needs. Customer needs assessment guide; needs-based training manual; product-system assessment guide. Diagnostician
Demonstrate Presentation of product features, benefits, or performance in visible and repeatable ways. Code when materials provide scripts, sequences, comparisons, or instructions for showing how products work. Do not code as demonstrate when materials only recommend products without showing how value is made visible through presentation or performance. Kitchen product demonstration script; advanced demonstration guide; product presentation framework. Demonstrator
Interact Organization of interpersonal engagement around products. Code when materials guide invitations, group participation, conversation, discussion, follow-up, or shared product experiences. Do not code as interact when materials involve one-way product description without evidence of social engagement or participant involvement. Hosted demonstration event guide; group engagement material; customer follow-up guide. Host
Advise Recommendation of products, bundles, or solutions based on interpreted needs or situations. Code when materials guide product choice, suggest bundles, match products to situations, or frame recommendations around fit. Do not code as advise when materials present product information without recommendation logic or need-product matching. Product bundle recommendation sheet; advisory script; expanded recommendation framework. Advisor
Facilitate Coordination of access, ordering, fulfillment, or transaction completion. Code when materials guide order placement, transaction coordination, delivery, fulfillment, checkout, or movement from recommendation to purchase. Do not code as facilitate when materials only generate interest or discussion without supporting exchange completion. Order coordination and fulfillment form; ordering system instruction sheet; transaction coordination checklist. Facilitator

Note: Codes were applied to observable actions in the artifacts before being grouped into practice categories and associated participation roles. Some artifacts contain multiple codes when they connect more than one form of participation, such as demonstration followed by advising or advising followed by facilitation.
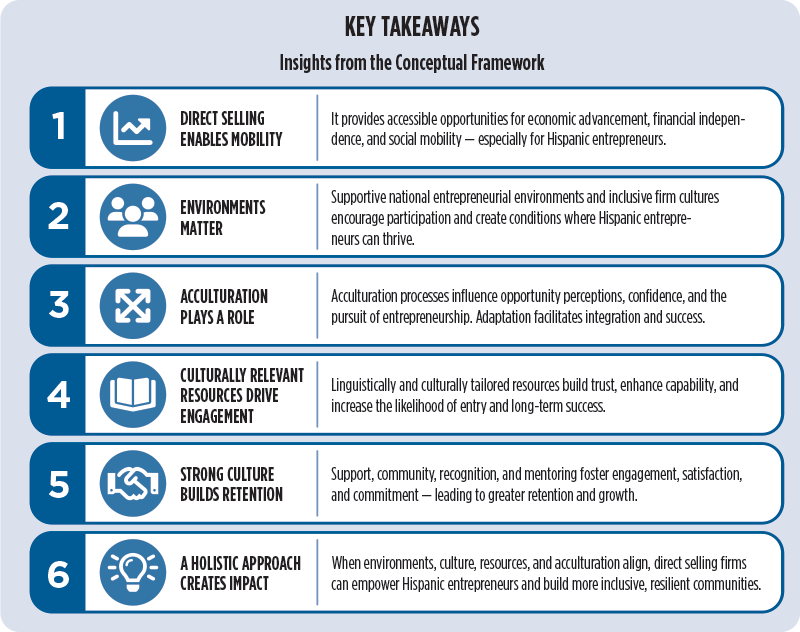
Entrepreneurial Environment and Culture in Direct Selling Entry Decisions of Hispanic Entrepreneurs: An Acculturation Approach

By SherRhonda R. Gibbs, PhD, Monica D. Guillory, PhD[1], Caroline Glackin, PhD

Background

Entrepreneurship has long served as a pathway for economic integration and acculturation of immigrants in the United States. This study suggests that the unique structure and features of the direct selling channel are particularly appealing to Hispanic entrepreneurs generally, supporting both business participation and acculturation into U.S. society.

Implications for Policymakers

  • Entrepreneurship depends on supportive government, economic, and organizational environments.
  • The Global Entrepreneurship Monitor (GEM) ranked the United States as 5th out of 31 in Total Early-stage Entrepreneurial Activity (TEA) and 16th in Established Business Ownership (EBO), among countries considered high-income economies.
    • Direct selling companies strengthen the entrepreneurial ecosystem by providing:
    • Low-barrier access to entrepreneurship.
    • Structured training, mentorship, and business resources, often in English and Spanish.
    • Entrepreneurial cultures that build self-efficacy and help Hispanic entrepreneurs develop the skills, norms, and networks that support business success and acculturation.

Abstract

Hispanic communities are disproportionately represented in the direct selling channel, yet little is known about the factors influencing direct selling entry decisions among Hispanic entrepreneurs. Drawing on acculturation theory and entrepreneurship literature, this study develops a conceptual model of external factors that influence direct selling entry decisions of Hispanic entrepreneurs and distributors. The literature suggests that supportive entrepreneurial environments and firm cultures may facilitate both entrepreneurial participation and acculturation. For Hispanic entrepreneurs, direct selling may provide opportunities for economic and social mobility while serving as a mechanism for integration into the broader society. The study contributes to the entrepreneurship literature by extending acculturation theory to the direct selling context and offers practical implications for firms seeking to attract and support Hispanic entrepreneurs.

Keywords: direct selling, acculturation, entrepreneurial environment, Hispanic entrepreneurs, entrepreneurial culture, minority entrepreneurship.

Executive Summary

Synopsis

This study examines acculturation and its application for Hispanics in the direct selling channel. With Hispanics constituting 26 percent of U.S. direct sellers (distributors), and the Hispanic population in the United States at 20 percent, there is an opportunity to understand the appeal of the channel to this population.

Methodology

This study analyzes the literature on acculturation theory, direct selling, the entrepreneurial environment, and Hispanics in the United States. It considers the data findings presented in the Hispanic Marketing Survey: Results Report (Gamse, 2016), the underlying data, and the data from the Direct Selling 2025 Growth and Outlook Study (DSEF, 2026). A conceptual model compiles findings from the literature into a viable model.

Results/Findings

Hispanics may become direct sellers for reasons of acculturation, social and economic mobility. Acculturation is more prominent in countries with strong entrepreneurial environments and direct selling entry decisions positively relate to the entrepreneurial culture in direct selling firms.

Conclusion and Implications for Theory, Research, and Practice

Direct selling firms that wish to increase the number of Hispanic distributors should strive to create a supportive entrepreneurial culture with culturally and linguistically specific and appropriate resources that facilitate success in the field salesforce.

Implications for Entrepreneurship Education

The study addresses the application of acculturation theory to Hispanics in the direct selling channel, providing insights into several topics that are not frequently a part of the entrepreneurship literature or the entrepreneurship classroom. While much has been written about minority entrepreneurship, little is known about the go-to-market strategies of the companies in which they engage and the cultural fit. We address the entrepreneurial culture of direct selling organizations, the culturally and linguistically appropriate resources provided for Hispanic distributors, and the national entrepreneurship environment. Entrepreneurship educators can begin to address ethnicity and acculturation in the classroom with more specificity and can discuss the direct selling channel as an entrepreneurial entry option and as a go-to-market strategy. It is important that we discuss entrepreneurial options across the spectrum and provide insights into them.

1) Introduction

Direct Selling is viewed as an attractive entrepreneurial entry point by minorities and immigrants. The direct selling retail channel offers a welcoming culture, low entry barriers, easy access to suppliers and customers, and accessible training programs. The Direct Selling Education Foundation defines direct selling as “a business model that provides entrepreneurial opportunities to individuals as independent contractors to market and/or sell products and services…” (DSEF, 2026). Hispanic communities are disproportionately represented in direct selling, constituting 26 percent of the direct selling salesforce despite being 20 percent of the U.S. population in 2025 (DSEF, 2026). Prior research has suggested that immigrant populations who are disadvantaged in the labor market pursue entrepreneurship (Sequeira & Rasheed, 2006), and the willingness to participate is compelled by the size of the group and encountering adverse environments (Evans, 1989). Plausible explanations for the large participation rates of Hispanic Immigrants and Hispanic Americans in direct selling are: (1) the entrepreneurial environment in these firms provides a means of economic sustainability (i.e., necessity entrepreneurship), and (2) firm culture in direct selling facilitates acculturation.

Acculturation is the “process of cultural and psychological change that takes place as a result of contact between cultural groups and their individual members (Berry, 2004, p. 27).” The acculturation process explains how individuals engage in intercultural contact to achieve desirable outcomes (Berry, 2005). Berry (2005) describes four acculturation strategies employed by immigrants and minorities who choose to engage or disengage with the host country or dominant culture. Strategies include integration, assimilation, separation, and marginalization. There is a growing body of extant literature that has focused on the importance of cultural and ethnic identity in the reasoning behind the selection of acculturation strategies (Williams & Liu, 2023; Forrest-Bank & Cuellar, 2018; Schwartz et al., 2006; Ting-Toomey et al., 2000) and the relationship between acculturation strategies and organizational outcomes of immigrant employees (Williams & Liu, 2023; Gurlek, 2021; Hajro et al., 2019, Hommey et al., 2020).

Marginalized minority communities beleaguered by perceived and practiced inequality may view direct selling opportunities as viable income-producing alternatives to overcome structural barriers which prohibit full integration or assimilation into dominant culture. Immigrants without permanent residency often rely on low wage or informal employment and may view self-employment in direct selling as an opportunity to transition into the host country culture. Gunter (2017) concluded in his study that the average rates of informal business ownership in the Hispanic community was 26.9 percent for Latinos and 14.2 for Latinas. The entrepreneurship literature is surprisingly lean on the topic.

To address this gap, we review acculturation theory, the criteria for strong national entrepreneurial environments, and entrepreneurial culture created by direct selling firms. We further theorized that supportive entrepreneurial environments and firm culture lead to acculturation and direct selling entry decisions. For Hispanic communities in particular, opportunities to develop professional networks and entrepreneurial businesses, yields dual benefits (e.g. self-employment and acculturation) which may explain the higher participation rates in direct selling.

We advance acculturation research in entrepreneurship by conceptually demonstrating how entrepreneurial environments within the context of the direct selling retail channel facilitates acculturation processes. The study specifically addresses the phenomenon of a disproportionate participation rate in direct selling relative to the Hispanic population in the United States. We suggest that the unique structure and features of the channel are particularly appealing to Hispanic immigrants and the general Hispanic population alike.

2) Literature Review/Theory Development Acculturation Theory

Acculturation theory originates from cross-cultural psychology and is applicable in business contexts. The acculturation process occurs when individuals are exposed to culturally different others or move from their home country to reside in another (host) country while navigating sociocultural and psychological changes that occur when transitioning towards the dominant culture (Schwartz, Unger, Zamboanga, & Szapocznik, 2010). While many Hispanic direct sellers have not moved from a home country to a host country, they experience the “otherness” in cultural and linguistic terms. According to Berry (1980), immigrants and minorities are faced with two questions upon arrival to host countries. The questions are categorized as acculturation dimensions. The first dimension refers to maintenance of the heritage culture (i.e., Is it important to maintain my heritage culture?), and the second dimension refers to host culture contact (i.e., Is it important to engage with the host culture?).

Scholars put forth unidimensional and bidimensional models of acculturation which immigrants can adopt in new societies. The unidimensional model infers a bidirectional dependency relationship between an individual’s host culture and heritage culture. The first viewpoint of the unidimensional model holds that the more individuals affiliate with the host culture, the more their affiliation with the heritage culture weakens. The second viewpoint suggests that the more individuals retain their heritage culture, the less likely they are to adopt host country culture (Laroche, Kim, Hui, & Joy, 1996), thus, a commitment to affiliate with the host culture (i.e., viewpoint one) weakens the heritage culture (i.e., viewpoint two). Conversely, the bidimensional model of acculturation posits that individuals’ affiliation with the host culture is largely independent of heritage culture (Berry, 1980). In the bidimensional model, each dimension can be assumed to have predictive power that is independent from the other (Cheung-Blunden & Juang, 2008).

Within each model, individuals pursue one of four acculturation strategies. First, assimilation refers to individuals seeking full participation in the host country by adopting the host country culture rather than their own. Second, separation refers to individuals who retain their heritage culture and avoid participating in the host culture. Third, integration refers to individuals who maintain their own cultural identity while also seeking to participate in the host culture. Fourth, marginalization refers to individuals who refrain from both heritage and host cultures. Marginalists do not acculturate towards either culture. As it relates to entrepreneurship, some authors postulate that integration is the optimal acculturation strategy (Arrighetti, Bolzani & Lasagni, 2017; Dheer, 2014).

Whereas most acculturation research centers on immigrants, a growing number of studies explore the phenomenon among minority groups or in colonial settings where a person’s own culture becomes subsidiary to another because of colonization (i.e., see Seitz, 1998; Cheung-Blunden & Juang, 2008). These studies may examine minorities (i.e., Hispanics, Native Americans, and Blacks) in the United States, or in British colonies and territories (i.e., Hong Kong) where native population culture is subordinate to British culture. Researchers found that in colonial settings, acculturation towards the majority culture resulted in maladaptive implications (i.e., adverse outcomes), and the bidimensional model was more robust in measuring outcomes influenced by psychological stress (Cheung-Blunden & Juang, 2008).

Difficulty with acculturation processes results in psychological maladjustments, or stress. Cheung-Blunden and Juang (2008) purport that when individuals are exposed to two or more cultures, norms, values and languages, acculturative stress occurs, and mental disturbances ensue (i.e., depression, negative affect, and poor academic achievement). Immigrants and minorities experience difficulties with acculturation when attempting an assimilation strategy without fully adjusting to mainstream society. Immigrants may be viewed as “passing” in mainstream society fostering rejection from the heritage culture and lowering self-esteem (Krishnan & Berry, 1992). Similarly, separation and marginalization yielded negative effects and life dissatisfaction resulting in isolation and exclusion (Berry, 1980). Drawing on Berry’s (1997) acculturation framework, many of the entrepreneurship studies have argued that integration — simultaneously maintaining one’s heritage culture while engaging with the host society — provides entrepreneurs access to broader social networks, knowledge, and resources and is generally associated with more favorable adaptation outcomes (Arrighetti et al., 2017; Szapocznik & Kurtines, 1980; Walsh et al., 2022). Immigrants or minorities with bicultural competence possess the attitudinal repertoire to transition between and successfully negotiate heritage and host cultures (Cheung-Blunden & Juang, 2008).

Acculturation perceptions indicate whether or not majority groups react positively to minority groups perceived as adopting an assimilation strategy compared to minorities choosing separation or marginalization (Kosic, Mannetti, & Sam, 2005). Although acculturation perceptions are beyond the scope of the current study, we assume that majority groups react positively to minorities attempting integration or assimilation acculturation strategies. Acculturation psychologists have called for more action-oriented research (Chirkov, 2009) that empowers acculturating individuals and communities, enhances social integration, and improves intergroup relations to better assist immigrant communities and immigrant-assisting organizations (Ward & Kagitcibasi, 2010). Scholars answered this call with contributions examining the components of integration to situate acculturation within social and political contexts (Paloma, Garcia-Ramirez & de la Mata, 2010). Other studies used Ward’s (2001) ABC framework to demonstrate how acculturation can be used to create opportunities for cultural maintenance in group settings (Smith, Smith & Peang-Meth, 2010), or multicultural programs to enhance social engagement (Sakurai, McCall-Wolf, & Kashima, 2010).

Our exploration of acculturation in domestic and entrepreneurial contexts is an appropriate contributive act to Chirkov’s (2009) call for action research. The United States has a rich history of hosting immigrants from every corner of the globe (e.g., Irish, Italian, Jewish, and Asian). Each of these immigrant groups tapped entrepreneurship as a social organizing acculturating mechanism to enter mainstream society. Hispanic immigrants are embarking upon a similar acculturation process into U.S. culture, and Hispanic American culture. Collectively, Hispanic immigrants and Hispanic Americans are swelling the ranks of entrepreneurship and direct selling. To advance the study’s framework on Hispanic direct selling entry decisions using acculturation, we transition the discussion towards the meaningful intersections of entrepreneurial environments, entrepreneurial culture in direct selling, and acculturation.

Entrepreneurial Environment

Entrepreneurship is influenced by relationships between entrepreneurs, enterprises and the environment (Lundström & Stevenson, 2005). Entrepreneurial environments are influenced by factors external to the firm (De Hoyos-Ruperto, Rummager, et al., 2012). Researchers point to institutional agreements, the role of government, economic policy, and country social structure as external factors contributing to the entrepreneurial environment (Lundström & Stevenson, 2005;). Generally, the entrepreneurial environment refers to the economic, social, cultural, and institutional conditions surrounding individuals that influence entrepreneurial cognitions, intentions, and venture creation decisions (Lim et al., 2010; Nguyen & Phan, 2024).

To capture the relative supportiveness of the entrepreneurial environment, the Global Entrepreneurship Monitor (GEM) publishes the total early-stage entrepreneurial activity (TEA) and entrepreneurial framework conditions (EFC) model using a national expert survey (NES) database and macro-variables to capture the extent of entrepreneurial finance, government entrepreneurship programs, entrepreneurship education, and cultural and social norms, to name a few. According to GEM, the entrepreneurial environment “directly influences the existence of entrepreneurial opportunities, entrepreneurial capacity and preferences, which in turn determines business dynamics. Hence, it is expected that different economies and regions have structures and quality of EFCs or different ‘rules of the game’ that directly affect entrepreneurial activity’s inputs and outputs (“What is the National Expert Survey (NES)?”, 2017). GEM ranked the United States as 5th out of 31 in total early-stage Entrepreneurial Activity (TEA) among countries that are considered high-income economies (more than $50,000 GDP per capita), and 16th in the established business ownership (EBO) rate among these same countries (DSEF, 2026).

GEM’s NES database provides information from experts on a particular country’s entrepreneurial framework conditions. EFCs may affect the creation and development of new firms (De Hoyos-Ruperto, Romaguera, et al., 2012), and although EFC factors are traditionally used to assess the entrepreneurial environments of countries, its components can also measure the entrepreneurial culture in SMEs, and the likelihood of new entrants in industries like direct selling. Entrepreneurial culture in firms has a considerable impact on entrepreneurial behavior as societal norms influence the resources individuals have access to and the entrepreneurial activities they undertake (Mueller & Thomas, 2001; Amine & Staub, 2009). Supportive entrepreneurial environments with plentiful economic resources lay the foundation for businesses to emerge, grow and succeed (Shabbir & DiGregorio, 1996; Pennings, 1982). Direct selling firms make concerted efforts to effectuate entrepreneurial cultures that build self-efficacy and promote the concept that entrepreneurial success results in societal integration.

Direct Selling: Definition, Background, and Culture

Direct selling has a long, interesting history in the United States. Direct selling companies use independent sales teams to market products and services, with the benefit of low start-up and overhead costs for distributor entrepreneurs (DSEF, 2017). For many types of organizations, direct selling is also a viable go-to-market strategy. The first organized trade group in the direct selling industry was Agents Credit Association, formed in 1910 for door-to-door salesmen (Taylor, 2012). For many decades, households were visited by representatives of companies such as Fuller Brush, Avon, Charles Chips, and World Book Encyclopedia. Direct selling then transitioned from door-to-door sales toward network selling (person-to-person) and party plans over the years.

According to the Direct Selling Education Foundation’s Growth and Outlook reports, U.S. direct selling retail sales peaked at $42.7 billion in 2021 before softening to $34.7 billion in 2024, which is more consistent with pre-pandemic sales levels. Similarly, the number of full- and part-time U.S. direct sellers decreased from 7.7 million in 2020 to 5.4 million in 2024, reflecting the industry’s post-pandemic adjustment period. Table 1 shows U.S. retail sales and the number of direct sellers. Within direct selling, there are person-to-person, party plan and other companies. The majority are person-to-person or network sales (71.5 percent) wherein a direct seller (representative, consultant, designer) sells directly to her customer. The second most popular method is the party plan (22.4 percent), wherein a direct seller sells to groups of customers in homes, other locations, or through an online party.

Table 1
Direct Sales Statistics

Year U.S. Retail Sales
($ billions)
U.S. Direct Sellers (millions)
2025 $34.2 5.2
2024 $34.7 5.4
2023 $36.7 7.3
2022 $40.5 6.7
2021* $42.7 7.3
2020 $40.1 7.7

Source: Growth & Outlook Reports (2021–2025) Washington, DC: Direct Selling Association.
*Start of the global pandemic

According to the Direct Selling Education Foundation, of the 5.2 million U.S. direct sellers, 73 percent are women, primarily selling person-to-person, in the categories of wellness, services, home and family care/home durables, personal care, clothing and accessories, and leisure/education. Of the 5.2 million business builders, 92.3 percent are part-time workers. Most direct sellers are between 35 and 54 years of age, with the two categories (35-44 years old; 45-55 years old) tying as the largest categories with 23% each.

Direct selling companies need to recruit and retain excellent independent representatives to generate revenues and to grow. Because they do not sell through brick-and-mortar retail stores or wholesalers, these representatives are their go-to-market strategy for the channel. Therefore, direct selling leaders focus considerable attention on the field salesforce. Interestingly, no sales experience is required, and recruitment is primarily through the distributor network. The cost of entry into direct sales is low, at an average of $262 for a starter kit, with 35% of DSA member companies surveyed offering $0 cost in this category (DSEF, 2023) and Direct Selling Association (DSA) member companies offer a 90% buyback of the cost of products and kits, a requirement of the DSA Code of Ethics (DSA 2026).Training, upline mentoring, and performance incentives are typical in the direct selling channel.

In recent years, direct selling firms have reframed, focusing more on the end customer, and creating entrepreneurial cultures with more transparency in the company-distributor-customer matrix (Fleming, 2017). Many direct sellers now track retail customers more carefully, and new strategies have been initiated to help distributors acquire customers, especially after the economic slowdown triggered by the pandemic. However, those in the industry remain optimistic even after the pandemic surge. Stuart Johnson, Chairman and Founder of Direct Selling News wrote, “The direct selling model isn’t a relic. It’s a viable opportunity that is showing signs of growth, particularly in the U.S.” and he further concluded that “Success in the remainder of 2025 and beyond won’t come from maintaining the status quo. It will belong to those ready to build what’s next. The past, my friends, is in the past (Johnson, 2025).” This aligns with an early quote from the World Federation of Direct Selling Associations 2024 report, “The growth potential for direct selling remains substantial, given the continuing desire of people for entrepreneurial opportunities” (Paulk, 2024).

Entrepreneurial Culture in Direct Selling

Differences in firm culture necessitate taking stock of cultural practices in direct selling companies to gain insight into unique entrepreneurial processes that position direct selling distributors for success (Sequeira, Gibbs, & Juma, 2014). Direct selling organizations provide more than materials and training. Each has a unique corporate culture and brand. They expend considerable resources creating and sharing this culture with their field salespeople. Charismatic company founders and leaders often become “larger than life” through their outreach to representatives, dynamic presence at annual gatherings, incentive trips, and social media posts. Direct selling networks, characterized by an inspiration-driven, collaborative atmosphere, promote work styles that support these networks (Bhattacharya & Mehtra, 2000; Biggart, 1989; Crittenden & Crittenden, 2004; Lan, 2002; Merrilees & Miller, 1999; Sparks & Schenk, 2001). Sales meetings are often filled with visible celebration, joy, tears, and pride, complemented by the effusive and expressive behavior exhibited by company leaders and distributors alike (Biggart, 1989). For example, Scentsy holds reunions for their salespeople rather than annual conferences. They are also highly motivational, encouraging representatives to “Swing for the Fences” (Scentsy in 2017). Mary Kay, Inc. is known to treat their “employees, consultants, customers and suppliers as family… ” Mary Kay Ash’s saying on balancing priorities in life, “Faith first, family second, and career third” is still a core company value (Crittenden & Crittenden, 2023, p.361), as evidenced by the Mary Kay consultants who continue to share this motto on their social media today. Rather than creating a fiercely competitive sales environment like those fostered in other personal selling companies, direct selling firms encourage collaboration and supportive environments where coaching and mentoring are encouraged and valued (Biggart, 1989).

Direct sellers in the United States are independent contractors paid commission for sales. Distributors in multi-level marketing organizations earn commissions on sales by individuals recruited as downline distributors. Most direct sellers work part-time, selling inside, or outside the home — in person, or online. Those engaged in party plans sell in other homes, workplaces or neutral settings in a social and entertainment-oriented environment (Peterson & Wotruba, 1996). Direct selling firms perpetuate an entrepreneurial culture that exposes distributors to entrepreneurial training, tools, and professional networking (Peterson & Wotruba, 1996). These practices develop an entrepreneurial mindset among the direct selling salesforce. Direct selling firms teach useful skills on relationship marketing, generating repeat business, and allow distributors to plug into the value chain at any point with access to suppliers, potential customers, physical resources, and virtual selling platforms (Peterson & Wotruba, 1996).

The life of a fully engaged distributor becomes intertwined with the company, its brand, and the lives of other distributors. In fact, Biggart (1989, p. 9) argued that “committed distributors see their work as a superior way of life that embraces political values, social relations, and religious beliefs. It gives them not a job, but a worldview, a community of like-minded others, and a self-concept.” More than this, distributors may come to see themselves as part of a “family” as they engage with the direct selling company and other representatives (Biggart, 1989). Distributors can easily and inexpensively join and exit the companies, yet they often join for the products and stay for the environment (Coughlan, Krafft, & Allendorf, 2017).

The direct selling industry eliminates entry barriers by lowering capital requirements for becoming a distributor, offering free training seminars (face-to-face and online), and developing Spanish-only product brochures and marketing campaigns which target Spanish-speaking distributors and consumers (Gamse, 2016). Even today, access to capital remains a salient problem among minority entrepreneurs. Minority entrepreneurs are still disproportionately denied loans by banking institutions, underfunded by investors, and lack fully developed social networks. Direct selling addresses these issues in its core structure. Like most U.S. businesses, direct selling firms are microcosms of societal entrepreneurial culture and cultural norms. More importantly for minority and disadvantaged populations, distributors integrate spheres of life normally separate in modern society (Biggart, 1989). Children, spouses, and even religious values are brought together in the enterprise. Direct selling draws minority entrepreneurs with a compelling promise of granting status and recognition to workers largely excluded from both in most workplaces (Biggart, 1989). Hence, we propose that:

Proposition 1: Strong national entrepreneurial environments (countries ranked highly on total early-stage entrepreneurial activity and entrepreneurial framework conditions) and entrepreneurial culture in direct selling firms will be positively related to direct selling entry decisions.

Hispanics in Direct Selling

Hispanics are increasingly important players in direct selling channels, both as distributors and as customers, particularly with the size of the U.S. Hispanic population growing exponentially. Because direct selling relies on face-to-face selling and social and family networks, it has shone a light on Hispanics in the salesforce. While the academic literature is essentially silent on the topic, the Direct Selling Association conducted surveys of member companies and their Hispanic distributors in 2016 to learn more about this influential group.

Princess House, Shaklee Corporation, and Gold Canyon are a subset of direct selling companies actively involved in the recruitment of Hispanic distributors and targeting the Hispanic market (Gamse, 2016). Hispanic distributors comprised more than twenty percent of the salesforce for fifty percent of firms targeting Hispanic markets during this time. Many firms had Spanish language materials primarily for marketing and training with replicated websites. Most had Spanish-fluent field leaders (83 percent) and call center staff (73 percent). Among Hispanic distributors, approximately 59 percent were of Mexican ancestry and 10.3 percent were Puerto Rican. This trend has continued. Recent industry reports within Direct Selling News indicate that many direct selling companies are intentionally expanding their efforts to recruit Hispanic distributors (Paulk, 2023). This is a trend that is consistent with demographic and entrepreneurship research on the growing economic influence of the U.S. Hispanic population (Gamse, 2016).

Recent evidence suggests that Hispanic Americans possess strong entrepreneurial orientations and substantial interest in self-employment. Nearly one-quarter of new entrepreneurs in the United States were Latino (Hispanic) (U.S. Department of the Treasury, 2023), and Latino-owned (Hispanic) employer firms increased by 44% between 2018 and 2023 (Steen, 2025). Furthermore, Hispanic workers demonstrate higher rates of self-employment than non-Hispanic workers across all age categories (Gumber and Martinez, 2025), indicating a strong propensity toward working for themselves and pursuing entrepreneurial opportunities. A key finding of the Consumer Trends study is “Hispanics seem to be the minority searching most for meaning and balance in their work yet not always finding it in their current jobs. As they are also the group most intrigued by the idea of working for themselves, direct selling could be a natural fit. (GfK Consumer Life, 2016, p. 100).” In fact, Hispanic-owned businesses have been one of the fastest-growing segments of U.S. entrepreneurship (Donoghoe et al., 2025). Quite possibly, industry strategies to grow its Hispanic salesforce and customer base could continue to spur the adoption of entrepreneurial culture and accelerate acculturation in Hispanic communities.

According to the DSA’s Hispanic Marketing Survey (2016, p.8):

Hispanic people involved in direct selling are more likely to be male, younger, single, have children, live in the West and South, and have less education than non-Hispanic direct sellers. They also provide more positive ratings of their direct selling experience than non-Hispanics. They are more satisfied with the experience and more likely to recommend direct selling to others. Hispanic people involved in direct selling also seem more committed to direct selling as they are more likely than non-Hispanics to work full time and to be satisfied with the amount of money earned for the amount of time spent on their business. They believe the materials provided by their direct selling organizations meet their needs and give high marks to their company for providing materials in languages other than English.

Direct Selling and Acculturation

Albeit scant, entrepreneurial scholars have initiated studies that examine the role of acculturation in entrepreneurship. A single study by Dheer (2014) consisted of a conceptual exploration on immigrants’ introduction and acculturation to a new society, and the resulting impact on his or her entrepreneurial intentions. The study contends that acculturation evokes cognitive outcomes of creativity, innovativeness, a desire for economic and social status excellence, and entrepreneurial intentions. Dheer (2014) notes that biculturals (those individuals who acculturate through integration) are more proficient at recognizing entrepreneurial opportunities when exposed to elements of the host and home culture given their wider knowledge base. Based upon Dheer’s (2014) findings; it stands to reason that if traditional entrepreneurial entry opportunities fail to materialize, direct selling distributorships may be viewed by immigrant and minority groups as a viable entrepreneurial entry point.

For Hispanic entrepreneurs, the attraction of direct selling stems from industry efforts to eliminate structural disadvantages and socially embedded institutional barriers, too great to overcome (Ramirez Bishop & Surfield, 2013; Samli & Molina, 2013; Suárez, 2016). Direct selling firms provide representatives with structured training platforms and other resources, often in Spanish and English, and supportive entrepreneurial environments in which nascent and novice entrepreneurs can quickly test their entrepreneurial acumen and success. Operations and procedures in firms usually reflect the dominant culture’s values, beliefs, and norms, allowing immigrants and minorities to use firm social structures to implement the necessary changes in behavior, attitudes, and cultural norms in pursuit of entrepreneurship. Direct selling firms’ engagement with independent sales representatives is frequent, inspirational, motivational, and heavily reliant on social networks, with a strong sense of family, and branding (Coughlan, Krafft, & Allendorf, 2017; Crittenden & Crittenden, 2004; Dai, Teo, & Wang, 2017).

Hispanic Community and Acculturation

Hispanics are the fastest growing demographic in the United States and the country’s second largest ethnic group. Between 2000 and 2024, the Hispanic population nearly doubled, rising from 35.3 million to 68 million, accounting for more than half of all U.S. population growth during that period (Pina and Martinez, 2025). Hispanics are extremely diverse with regard to race, ethnicity, and culture. Although most Hispanics are from collectivistic countries and cultures, differences abound. Hispanics speak various languages (i.e., English, Spanish, Portuguese), have unique cultural traditions and celebrations, and signature cuisines. A survey on Hispanic entrepreneurs found that many identify more with ethnicity (i.e., Mexican, Puerto Rican, Chicano) rather than race (i.e., White, Black). Acculturation issues may develop from social and cultural differences in Hispanic communities which lead to social and economic disadvantage, stereotyping, and discrimination (Christiansen, 2010).

Diverse ethnicities, subcultures, and environmental conditions obfuscate acculturation in Hispanic communities. Entrepreneurship, however, may be the unifying factor. Suárez’s (2016) study compared Hispanic immigrants and U.S.-born Hispanic entrepreneurs. Suárez found that U.S. Hispanics have higher self-esteem than Hispanic immigrants, and Hispanic immigrants had lower educational levels and greater external locus of control (Suárez, 2016). The preponderance of acculturation research centers on immigrants; however, research findings often relate to minority groups, such as U.S.-born Hispanics, whose subcultures vary from the dominant culture, particularly in ethnic enclaves (Berry, 1997; Cheung-Blunden & Juang, 2008; Seitz, 1998). Certain personal (i.e., self-efficacy) and sociocultural factors (i.e., social recognition, legitimacy) influence the extent to which immigrant and minority groups pursue acculturation (Berry, 1997; Dheer, 2014). These factors not only predict acculturation but entrepreneurial intentions as well (Boyd & Vozikis, 1994; Dheer, 2014). The remarkable connection implies that acculturation may not only act as a determinant for entrepreneurial or direct selling entry but may also interact with certain factors (i.e., race, entrepreneurial environment, entrepreneurial culture, resources offered) to strengthen entry decisions.

As a group, Hispanic entrepreneurs hold more traditional attitudes towards working women, have lower perceptions of mastery, and a slightly greater external locus of control (Ramirez Bishop & Surfield, 2013). Latina entrepreneurs, a relatively disadvantaged group, choose self-employment for non-pecuniary reasons (Lofstrum & Bates, 2009). These findings may indicate an environmental dependency on the part of Hispanic entrepreneurs. Of great interest to the current study is Abebe’s (2012) finding that social factors (i.e., social status and social support) are predictors of entrepreneurial career intentions among Hispanic adults. Direct selling firms provide ample social support and entrepreneurial resources for distributors which could explain why direct selling is attractive to Hispanics.

Collectively, Ramirez Bishop & Surfield (2013), Lofstrum and Bates (2009), and Abebe (2012) allude to theoretical assumptions that social and environmental forces propel Hispanics toward self-employment, for which direct selling is a form. Analogous to Hispanic American entrepreneurs, Hispanic immigrants use transnational entrepreneurship as a means of acquiring material gains, social status, and expanding their middle-class status (Zhou, 2004). Sociocultural transnationalism serves to “forge and sustain multi-stranded social relations that link together their societies of origin and settlement (Basch, Glick-Schiller, & Blanc-Szanton, 1994, p. 6).” A study by Allen and Busse (2016) describe personal and business acculturation as a form of breakout and found that Latino immigrant business owners positioning themselves for breakout initiate casual social interaction with non-Latino residents and customers. The authors purport that Latino immigrants achieve breakout by creating spaces (i.e., restaurants, markets, and retail) of social cohesion, cross-ethnic interaction, encounters and cultural consumption by non-Latinos (Allen & Busse, 2016).

Most Hispanic entrepreneurs rate acculturation as being very positive to their communities and businesses (Samli & Molina, 2013). Samli & Molina’s (2013) strategic model for successful Hispanic entrepreneurship depicts support systems and strategic tools such as the ability to assess the degree of acculturation of Hispanic consumers as prerequisites to success. Prior studies intimate that minorities pursue entrepreneurship due to ‘push’ factors such as social integration, and social and economic mobility (Mavoothu, 2009; Suarez, 2016), giving further evidence of causality between entrepreneurship and acculturation. As a whole, Hispanic populations may view the culture of direct selling as a path to entrepreneurship, and a bridge between the familiar heritage culture, and the unfamiliar host, or dominant culture. Moreover, scholarly discourse alludes to the premise that Hispanics enter direct selling to facilitate acculturation, achieve economic and social mobility, and more often than not, acculturate using integration strategies.

Proposition 2: The availability of Hispanic cultural and linguistic resources from direct selling firms will positively relate to direct selling entry decisions, and moderate the relationship between strong national entrepreneurial environments, entrepreneurial culture in direct selling firms, and Hispanic direct selling entry decisions.

Proposition 3: Acculturation moderates the relationship between direct selling entry decisions of Hispanics in host countries with strong national entrepreneurial environments (ranked highly on total early-stage entrepreneurial activity or entrepreneurial framework conditions), and entrepreneurial culture in direct selling firms. This relationship will hold for bicultural Hispanics who enter the direct selling channel for economic and social mobility and acculturate using integration.

Figure 1 shows the proposed framework of acculturation, entrepreneurial environment and direct selling entry decisions.

Figure 1: Entrepreneurial environment, entrepreneurial culture and acculturation as determinants of Hispanic direct selling entry.Results/Findings

Overall, it was found that acculturation can be useful in explaining direct selling entry decisions of Hispanic distributors. Supportive host country entrepreneurial environments and firm cultures attract individuals to the industry, and social integration through acculturation is a desirable outcome as Hispanic immigrants pursue economic and social mobility with hopes of expanding to the ranks of the middle class. Hispanics’ preferred acculturation strategy seems to be integration, and to a lesser extent, assimilation. Successful acculturation leads to positive psychological adjustment in minority communities, and in large part may have contributed to the relative success achieved by Hispanics in the direct selling industry.

3) Conclusion and Implications for Theory, Research, and Practice

We conducted a thorough conceptual review of three externalities that impact direct selling entry decisions of Hispanics. More specifically, the intersection of acculturation, national entrepreneurial environments and entrepreneurial culture are critical in the distributorship decision, along with an understanding of needed cultural resources. The framework developed advances theory on cross-cultural psychology and entrepreneurial entry in the direct selling channel.

There are several managerial implications for direct selling organizations that leverage both entrepreneurial culture and acculturation processes to improve recruitment, retention, and venture success among Hispanic/Latino entrepreneurs. First, direct selling firms can establish bicultural onboarding and mentorship programs that pair new Hispanic/Latino distributors with successful bilingual mentors. Beyond product and sales training, these programs can provide support in networking, business communication, financial literacy, and relationship building. Such initiatives enable new entrants to maintain their cultural identity while developing the competencies needed to operate effectively in the broader business environment. By reducing uncertainty and increasing access to social capital, these relationships may strengthen entrepreneurial persistence and contribute to long-term business growth. Second, direct selling organizations can sponsor culturally responsive events that connect Hispanic/Latino distributors with the broader business ecosystem. Through bilingual programming, networking opportunities, and workshops on topics such as access to capital, business regulations, digital marketing, and wealth creation, these events can strengthen entrepreneurial self-efficacy and accelerate acculturation by increasing access to professional networks and institutional resources.

Third, direct selling firms can leverage their entrepreneurial culture to create community-based initiatives for Hispanic/Latino entrepreneurs and their families. Programs such as family entrepreneurship workshops, youth entrepreneurship camps, and leadership development activities can build on collectivistic cultural values while connecting participants to broader economic and professional networks. By engaging existing family support systems, these initiatives may strengthen entrepreneurial commitment, improve retention, and enhance social and economic mobility within Hispanic/Latino communities. Collectively, these strategies suggest that direct selling organizations can move beyond traditional recruitment and sales training by promoting entrepreneurial socialization, cultural integration, and economic empowerment.

We believe this study to be a useful starting point for future research on direct selling, entrepreneurship and acculturation in many contexts. A logical next step would be empirically testing and validating the model using direct selling channel salesforce data and extending the model to determine whether acculturation leanings may result in a decision to stay or leave the distributorship.

4) Implications for Entrepreneurship Education

The study addresses the application of acculturation theory to Hispanics in the direct selling channel, providing insights into several topics that are not frequently a part of the entrepreneurship literature or the entrepreneurship classroom. While much has been written about minority entrepreneurship, little is known about the go-to-market strategies of the companies in which they engage and the cultural fit. We address the entrepreneurial culture of direct selling organizations, the culturally and linguistically appropriate resources provided for Hispanic distributors, and the national entrepreneurship environment. Entrepreneurship educators can begin to address ethnicity and acculturation in the classroom with more specificity and can discuss the direct selling channel as a viable option for entrepreneurial entry and integration into dominant culture.


[1]  Corresponding Author


Dr. SherRhonda Gibbs is a Professor of Management and President of Texas College.

Dr. Monica D. Guillory is an Associate Professor of Marketing at Morehouse College.

Dr. Caroline Glackin is the Thomas Family Distinguished Professor of Entrepreneurship at the University of North Carolina Pembroke.

References

  • Abebe, M. A. (2012). Social and institutional predictors of entrepreneurial career intention: Evidence from Hispanic adults in the U.S. Journal of Enterprising Culture, 20(1), 1–13.
  • Allen, R., & Busse, E. (2016). The social side of ethnic entrepreneur breakout: Evidence from Latino immigrant business owners. Ethnic and Racial Studies, 39(4), 653–670.
  • Amine, L. S., & Staub, K. M. (2009). Women entrepreneurs in sub-Saharan Africa: An institutional theory analysis from a social marketing point of view. Entrepreneurship & Regional Development, 21, 183–211.
  • Arrighetti, A., Bolzani, D., & Lasagni, A. (2017). Acculturation and ethnic hybridism in immigrant entrepreneurship. Argomenti, 8, 27–48. https://doi.org/10.14276/1971-8357.1057
  • Basch, L., Glick Schiller, N., & Blanc-Szanton, C. (1994). Nations unbound: Transnational projects, post-colonial predicaments and deterritorialized nation states. Gordon and Breach.
  • Berry, J. W. (1980). Acculturation as varieties of adaptation. In A. M. Padilla (Ed.), Acculturation: Theory, models, and some new findings (pp. 9–25). Westview Press.
  • Berry, J. W. (1997). Immigration, acculturation, and adaptation. Applied Psychology, 46(1), 5–34.
  • Berry, J. W. (2004). Acculturation. In C. Spielberger (Ed.), Encyclopedia of applied psychology (pp. 27–34). Elsevier.
  • Berry, J. W. (2005). Acculturation: Living successfully in two cultures. International Journal of Intercultural Relations, 29(6), 697–712.
  • Bhattacharya, P., & Mehtra, K. (2000). Socialization in network marketing organizations: Is it cult behavior? Journal of Socio-Economics, 29, 361–374.
  • Biggart, N. W. (1989). Charismatic capitalism: Direct selling organizations in America. University of Chicago Press.
  • Boyd, N. G., & Vozikis, G. S. (1994). The influence of self-efficacy on the development of entrepreneurial intentions and actions. Entrepreneurship Theory and Practice, 18, 63–77.
  • Bromley, D. G. (1998). Transformative movements and quasi-religious corporations: The case of Amway. Sacred companies: Organizational aspects of religion and religious aspects of organizations, 349-363.
  • Cheung-Blunden, V. L., & Juang, L. P. (2008). Expanding acculturation theory: Are acculturation models and the adaptiveness of acculturation strategies generalizable in a colonial context? International Journal of Behavioral Development, 32(1), 21–33.
  • Chirkov, V. (2009). Summary of the criticism of and potential ways to improve acculturation psychology. International Journal of Intercultural Relations, 33, 177–180.
  • Crittenden, V.L., & Crittenden, W.F. (2023). The power of language to influence people: Mary Kay Ash the entrepreneur. Journal of Research in Marketing and Entrepreneurship, 25(3), 349-373.
  • Coughlan, A., Krafft, M., & Allendorf, J. (2016). Join, stay, leave: A study of the salesforce (Working paper).
  • Crittenden, V. L., & Crittenden, W. F. (2004). Developing the sales force, growing the business: The direct selling experience. Business Horizons, 47(5), 39–44.
  • Dai, F., Teo, S. T. T., & Wang, K. Y. (2017). Network marketing businesses and Chinese ethnicity immigrants in Australia. Journal of Small Business Management, 55(3), 444–459.
  • De Hoyos-Ruperto, M., Romaguera, J. M., Carlsson, B., & Perelli, S. (2012). Entrepreneurial environment dilemma in Puerto Rico: A challenge of self and system. Journal of Marketing Development and Competitiveness, 6(3), 11–28.
  • Dheer, R. S. (2014). Cognitive implications of acculturation: Impact on entrepreneurial intentions. Academy of Management Proceedings, 2014(1), 1532–1537. https://doi.org/10.5465/AMBPP.2014.165
  • Direct Selling Association. (2017). 2017 Growth and Outlook Report: U.S. Direct Selling in 2016.
  • Direct Selling Education Foundation. (2023). 2023 National Salesforce Survey.
  • Direct Selling Education Foundation. (2026). Direct selling in the United States: 2025 Industry Overview. https://dsef.org/wp-content/uploads/2026/08/dsa-2025-g-o-factsheet.pdf
  • Donoghoe, M., Stephens, H., Khan, F., & Perry, A. M. (2025, April 30). Charting the surge in Latino or Hispanic-owned businesses in the US. Brookings Institution. https://www.brookings.edu/articles/charting-the-surge-in-latino-or-hispanic-owned-businesses-in-the-us/
  • Evans, M. D. R. (1989). Immigrant entrepreneurship: Effects of ethnic market size and isolated labor pool. American Sociological Review, 54(6), 950–962.
  • Fleming, J. (2017, October). Defining distributors versus customers. Direct Selling News, 18, 32.
  • Forrest-Bank, S. S., & Cuellar, M. J. (2018). The mediating effects of ethnic identity on the relationships between racial microaggression and psychological well-being. Social Work Research, 42(1), 44–56. https://doi.org/10.1093/swr/svx023
  • Gamse, B. (2016). Hispanic marketing survey: Results report. Direct Selling Association.
  • GfK Consumer Life. (2016). U.S. consumer trends impacting the direct selling industry. Roper Reports.
  • Gumber, C., & Martinez, A. (2025, June 18). New Census Bureau tables reveal differences in work arrangements among Hispanic and non-Hispanic populations. U.S. Census Bureau. https://www.census.gov/library/stories/2025/06/hispanic-self-employment.html
  • Gunter, S. R. (2017). Dynamics of urban informal labor supply in the United States. Social Science Quarterly, 98(1), 16–36.
  • Gürlek, M. (2021). Workplace ostracism, Syrian migrant workers’ counterproductive work behaviors, and acculturation: Evidence from Turkey. Journal of Hospitality and Tourism Management, 46, 336–346. https://doi.org/10.1016/j.jhtm.2021.01.012
  • Hajro, A., Stahl, G. K., Clegg, C. C., & Lazarova, M. B. (2019). Acculturation, coping, and integration success of international skilled migrants: An integrative review and multilevel framework. Human Resource Management Journal, 29(3), 328–352.
  • Hommey, C., Ma, J., Asamani, L., & Hanson, P. (2020). The moderating effect of acculturation strategies on the relationship between newcomer adjustment and employee behavior. Frontiers in Psychology, 11, Article 2117. https://doi.org/10.3389/fpsyg.2020.02117
  • Johnson, S. (2025, July 22). Direct selling isn’t declining — It’s evolving. Direct Selling News. https://www.directsellingnews.com/2025/07/22/direct-selling-isnt-declining-its-evolving/
  • Krishnan, A., & Berry, J. W. (1992). Acculturative stress and acculturation attitudes among Indian immigrants to the United States. Psychology and Developing Societies, 4(2), 187–212.
  • Lan, P.-C. (2002). Networking capitalism: Network construction and control effects in direct selling. The Sociological Quarterly, 43(2), 165–184.
  • Laroche, M., Kim, C., Hui, M. K., & Joy, A. (1996). An empirical study of multidimensional ethnic change: The case of the French Canadians in Quebec. Journal of Cross-Cultural Psychology, 27(1), 114–131.
  • Lim, D. S., Morse, E. A., Mitchell, R. K., & Seawright, K. K. (2010). Institutional environment and entrepreneurial cognitions: A comparative business systems perspective. Entrepreneurship Theory and Practice, 34(3), 491–516.
  • Lofstrom, M., & Bates, T. (2009). Latina entrepreneurship. Small Business Economics, 33, 427–439.
  • Lundström, A., & Stevenson, L. (2005). Entrepreneurship policy: Theory and practice. Springer Science+Business Media.
  • Mavoothu, D. (2009). A literature review on the benefits of ethnic and minority entrepreneurship. Journal of Asia Entrepreneurship and Sustainability, 5(2), 46–58.
  • Merrilees, B., & Miller, D. (1999). Direct selling in the west and east: The relative roles of product and relationship (guanxi) drivers. Journal of Business Research, 45(3), 267–273.
  • Mueller, S. L., & Thomas, A. S. (2001). Culture and entrepreneurial potential: A nine-country study of locus of control and innovativeness. Journal of Business Venturing, 16, 51–75.
  • Nguyen, T. T., & Phan, H. T. T. (2024). Entrepreneurship environments and entrepreneurial intention: The role of self-efficacy and role model. International Journal of Engineering Business Management, 16, Article 18479790241275925. https://doi.org/10.1177/18479790241275925
  • Paloma, V., García-Ramírez, M., de la Mata, M., & A.M.A.L. Association. (2010). Acculturative integration, self and citizenship construction: The experience of Amal-Andaluza, a grassroots organization of Moroccan women in Andalusia. International Journal of Intercultural Relations, 34(2), 101–113.
  • Paulk, S. (2023, November 1). Hispanic market is booming: Are you keeping pace? Direct Selling News. https://www.directsellingnews.com/2023/11/01/hispanic-market-is-booming/
  • Paulk, S. (2024, October 1). 2023 billion dollar markets. Direct Selling News. https://www.directsellingnews.com/2024/10/01/2023-billion-dollar-markets/
  • Pennings, J. M. (1982). The urban quality of life and entrepreneurship. Academy of Management Journal, 23, 63–79.
  • Peterson, R. A., & Wotruba, T. R. (1996). What is direct selling? Definition, perspectives, and research agenda. Journal of Personal Selling and Sales Management, 16(4), 1–16.
  • Pina, G., & Martinez, G. (2025, October 22). Key facts about U.S. Latinos. Pew Research Center. https://www.pewresearch.org/short-reads/2025/10/22/key-facts-about-us-latinos/
  • Ramirez Bishop, D., & Surfield, C. J. (2013). Hispanic entrepreneurs: Moving forward by looking back. Journal of Marketing and Management, 4(2), 1–34.
  • Sakurai, T., McCall-Wolf, F., & Kashima, E. S. (2010). Building intercultural links: The impact of a multicultural intervention programme on social ties of international students in Australia. International Journal of Intercultural Relations, 34(2), 176–185.
  • Samli, A. C., & Molina, D. F. (2013). The critical problems of Hispanic entrepreneurs in decision making: Strategic implications. Annals of the Society for Marketing Advances Proceedings, 2.
  • Schwartz, S. J., Montgomery, M. J., & Briones, E. (2006). The role of identity in acculturation among immigrant people: Theoretical propositions, empirical questions, and applied recommendations. Human Development, 49(1), 1–30. https://doi.org/10.1159/000090303
  • Schwartz, S. J., Unger, J. B., Zamboanga, B. L., & Szapocznik, J. (2010). Rethinking the concept of acculturation: Implications for theory and research. American Psychologist, 65(4), 237–251.
  • Seitz, V. (1998). Acculturation and direct purchasing behavior among ethnic groups in the U.S.: Implications for business practitioners. Journal of Consumer Marketing, 15(1), 23–31.
  • Sequeira, J. M., Gibbs, S. R., & Juma, N. A. (2016). Factors contributing to women’s venture success in developing countries: An exploratory analysis. Journal of Developmental Entrepreneurship, 21(1), Article 1650001.
  • Sequeira, J. M., & Rasheed, A. A. (2006). Start-up and growth of immigrant small business: The impact of social and human capital. Journal of Developmental Entrepreneurship, 11(4), 357–375.
  • Shabbir, A., & Di Gregorio, S. (1996). An examination of the relationship between women’s personal goals and structural factors influencing their decisions to start a business: The case of Pakistan. Journal of Business Venturing, 11, 507–529.
  • Smith, S. T., Smith, K. D., & Peang-Meth, A. (2010). University-based services for asylum seekers on Guam: Empowerment, culture learning and community. International Journal of Intercultural Relations, 34(2), 150–162.
  • Sparks, J. R., & Schenk, J. A. (2001). Explaining the effects of transformational leadership: An investigation of the effects of higher-order motives in multilevel marketing organizations. Journal of Organizational Behavior, 22(8), 849–869.
  • Steen, M. (2025, March 27). A decade of data shows Latino entrepreneurs growing and adapting. Stanford Graduate School of Business. https://www.gsb.stanford.edu/insights/decade-data-shows-latino-entrepreneurs-growing-adapting
  • Suárez, M. D. (2016). An assessment of Hispanic entrepreneurship in the United States. Journal of Multidisciplinary Research, 8(3), 67–82.
  • Szapocznik, J., & Kurtines, W. (1980). Acculturation, biculturalism and adjustment among Cuban Americans. In A. M. Padilla (Ed.), Acculturation: Theory, models, and some new findings (pp. 139–159). Westview Press.
  • Ting-Toomey, S., Yee-Jung, K. K., Shapiro, R. B., Garcia, W., Wright, T. J., & Oetzel, J. G. (2000). Ethnic/cultural identity salience and conflict styles in four U.S. ethnic groups. International Journal of Intercultural Relations, 24(1), 47–81. https://doi.org/10.1016/S0147-1767(99)00023-1
  • U.S. Department of the Treasury. (2023, October 12). Latino business ownership up, pandemic recovery efforts helped grow Latino-owned businesses. https://home.treasury.gov/news/press-releases/jy1798
  • Walsh, L., & Cooney, T. (2023). Understanding the interplay between immigrant nascent entrepreneurship and cross-cultural adaptation. Journal of Small Business and Enterprise Development, 30(5), 919–946.
  • Ward, C., & Kagitcibasi, C. (2010). Introduction to acculturation theory, research and application: Working with and for communities. International Journal of Intercultural Relations, 34(2), 97–100.
  • What Is the National Expert Survey (NES)? (n.d.). Global Entrepreneurship Monitor. http://gemconsortium.org/wiki/1142
  • Williams, M. S., & Liu, C. (2023). Who am I and where do I belong? The impact of heritage cultural identity salience on immigrant workers’ acculturation strategies. Journal of International Migration and Integration, 24(2), 793–815. https://doi.org/10.1007/s12134-022-00978-7
  • Zhou, M. (2004). Revisiting ethnic entrepreneurship: Convergences, controversies, and conceptual advancements. International Migration Review, 38(3), 1040–1074.

Inside the Modern Direct Selling Channel and Salesforce

By Monica Wood

Direct selling occupies a unique space at the intersection of entrepreneurship, retail, and the evolving independent workforce. While often associated with product categories such as wellness, beauty, household goods, and services, direct selling is fundamentally a distribution channel through which companies reach consumers using networks of independent sellers rather than traditional retail storefronts. These independent sellers introduce products to customers through personal relationships, social networks, online communities, and direct recommendations, creating a highly personalized purchasing experience.

This article offers a look into the broader economic and workforce trends of the channel. As Americans increasingly seek flexible ways to develop entrepreneurial skills or pursue work that fits around family and career obligations, direct selling continues to offer a low-barrier entry point to independent work. Unlike many traditional small businesses, participation typically requires minimal upfront investment and allows individuals to engage on a part-time, full-time, or occasional basis according to their goals and circumstances.

At the same time, consumer expectations are changing. Many shoppers increasingly value personalized service, trusted recommendations, community connections, and convenient purchasing experiences that blend digital and social engagement. These shifts have encouraged direct selling companies to modernize their business models, adopt new technologies, and invest in innovative approaches to customer acquisition and relationship-building. Recent research also indicates growing consumer interest in both the products offered through direct selling and the entrepreneurial opportunities the channel provides.

The DSEF Direct Selling Growth & Outlook Survey provides an annual snapshot of the size, scope, and direction of this people-powered channel. Audited by an independent third-party economic consulting firm, the study tracks key indicators including retail sales, customer participation, and salesforce engagement, offering business leaders, researchers, regulators, and policymakers valuable insights into one of America’s largest entrepreneurial and relationship-driven distribution channels. The data and findings presented throughout this article are derived from the survey results and estimates of the DSEF 2026 Growth & Outlook Study based on 2025 industry data and trends.

A deeper analysis of the direct selling channel in the United States reveals encouraging trends that underscore the resilience and adaptability of the channel.

A critical driver of this resilience is the continued strength of its core salesforce, particularly women and Hispanic entrepreneurs, who represent a vital foundation of the channel’s growth and cultural relevance. Their strong participation not only fuels sales activity but also enhances community trust, expands market reach, and reflects the increasingly diverse face of entrepreneurship in the United States.

The rapid growth of service-based offerings, improved workforce stability, and alignment with modern consumer behavior collectively point toward a strong and sustainable future. By embracing innovation while maintaining its core strengths — flexibility, personalization, and entrepreneurial opportunity — the direct selling channel is well-positioned to thrive in the years ahead.

Importantly, the channel’s accessibility continues to create meaningful economic opportunities, especially for women seeking flexible work and for Hispanic communities that are driving population and small business growth nationwide. This demographic strength reinforces the channel’s ability to remain relevant and responsive to evolving consumer needs.

Competitive Advantages of the Direct Selling Model infographic

Direct Selling Retail Sales in the US

Direct selling in the United States represents $34.2 billion in retail sales in 2025. In addition, there were 34.8 million customers and 5.2 million full- and part-time direct sellers.

Source: DSEF Growth & Outlook annual industry sizing report.

Direct Sellers and Customers

A total of 5.2 million direct sellers engaged in either full-time (30 or more hours per week) or part-time (fewer than 30 hours per week) business activities. These individuals market products and services directly to consumers and may also recruit others to join their sales network.

Full-time direct sellers: 0.4 million

Part-time direct sellers: 4.8 million
5.2 million direct sellers operate in the U.S.

Source: DSEF Growth & Outlook annual industry sizing report.

A total of 34.8 million individuals are classified as Preferred Customers and Discount Buyers. Discount buyers are eligible to purchase, sell, and sponsor, but are product lovers, only purchasing products/services they personally enjoy and use at a discount. Preferred customers have signed a preferred customer agreement with a direct selling company where they may be eligible to pay wholesales prices for products/services. They are not eligible to sell products/services to others, and they are not eligible to earn.

Direct selling preferred customers: 28.4 million

Direct selling discount buyers: 6.4 million

Source: DSEF Growth & Outlook annual industry sizing report.

Demographic Profile of the Direct Selling Sales Force

Source: DSEF Growth & Outlook annual industry sizing report.

Source: DSEF Growth & Outlook annual industry sizing report.

Demographics include both direct sellers and discount buyers

Hispanic participation in direct selling increased to 26% in 2025. According to U.S. Census Bureau estimates, the Hispanic and Latino population represents approximately 20% of the total U.S. population.

Hispanic Ethnicity

Source: DSEF Growth & Outlook annual industry sizing report.

Source: DSEF Growth & Outlook annual industry sizing report.

Women and Hispanic participants represent two of the most important and defining demographic segments in the U.S. direct selling channel. Women dominate participation, accounting for 73% of all direct sellers and discount buyers. The level of participation by women historically aligns with the need for balancing flexible independent work with personal or family responsibilities.

At the same time, Hispanic individuals make up about 26% of participants, a significant share that highlights the channel’s effectiveness in engaging diverse communities. Based on the DSEF 2023 National Salesforce Study, “Sellers who are newer to direct selling are more likely to be Hispanic, be younger, and represent multiple companies.” The importance of Hispanic sellers is amplified by their demographic growth and strong community networks, which naturally complement relationship-based selling models. Together, women and Hispanic entrepreneurs not only drive a substantial portion of direct selling activity but also reinforce its inclusive, grassroots nature — fueling both economic opportunity and deeper consumer connection across the U.S. market.

National Direct Selling by State

In 2025, direct selling activity remained highly concentrated in several leading states, with California and Texas maintaining the largest participation and highest sales volumes. California led the nation with approximately 1.26 million individuals engaged in direct selling, generating an estimated $3.6 billion in sales. Texas closely followed, with about 1.25 million participants and $3.3 billion in sales.

Florida ranked third, demonstrating strong engagement with 843,845 individuals and total sales of $2.3 billion. New York held the fourth position, recording 524,907 participants and $1.8 billion in sales revenue. Illinois followed, with 463,647 individuals involved and $1.3 billion in direct sales.

Several other states showed steady performance in both participation and revenue generation. North Carolina reported 416,216 participants and $1.2 billion in sales, while Pennsylvania recorded 366,407 individuals and $1.1 billion. Wisconsin and Ohio also contributed significantly, with 315,459 and 383,937 participants respectively, each generating approximately $1.1 billion in sales. Georgia completed the top ten, with 340,361 individuals engaged in direct selling and total sales reaching $1.1 billion.

Overall, these figures highlight the continued importance of direct selling as a substantial economic activity across US states, characterized by broad participation and significant revenue contribution.

A detailed breakdown of direct sales volume and the number of direct sellers by state is below.


State/Territory People involved in direct Selling Retail Sales
Alabama 169,970 $450M
Alaska 16,566 $65M
Arizona 225,267 $692M
Arkansas 84,570 $280M
California 1,258,468 $3.6B
Colorado 294,345 $765M
Connecticut 88,242 $287M
Delaware 34,701 $99M
Florida 843,845 $2.3B
Georgia 340,361 $1.1B
Hawaii 24,516 $150M
Idaho 91,275 $249M
Illinois 463,647 $1.3B
Indiana 287,240 $837M
Iowa 151,664 $568M
Kansas 133,397 $343M
Kentucky 143,028 $422M
Louisiana 128,110 $442M
Maine 33,103 $89M
Maryland 204,825 $627M
Massachusetts 132,404 $487M
Michigan 319,795 $939M
Minnesota 228,715 $629M
Mississippi 81,963 $288M
Missouri 214,223 $618M
Montana 57,877 $163M
Nebraska 119,394 $371M
Nevada 97,020 $306M
New Hampshire 28,427 $103M
New Jersey 274,881 $842M
New Mexico 76,930 $201M
New York 524,907 $1.8B
North Carolina 416,216 $1.2B
North Dakota 54,821 $148M
Ohio 383,937 $1.1B
Oklahoma 153,457 $472M
Oregon 141,787 $378M
Pennsylvania 366,407 $1.1B
Rhode Island 23,738 $51M
South Carolina 186,684 $527M
South Dakota 72,858 $263M
Tennessee 222,579 $679M
Texas 1,247,602 $3.3B
Utah 134,830 $489M
Vermont 12,070 $35M
Virginia 287,018 $889M
Washington 198,771 $592M
West Virginia 55,829 $170M
Wisconsin 315,459 $1.1B
Wyoming 34,962 $96M
District of Columbia 8,000 $14M
Guam 2,377 $6M
Puerto Rico 65,694 $181M
U.S. Virgin Islands 1,010 $2M
N. Mariana Islands 174 $0M
American Samoa 0 $0M
Overseas U.S. Military 42 $0.2M


Salesforce Stability: A Significant Advantage

One of the most encouraging findings in the data is the consistently lower turnover rate in direct selling compared to traditional retail.

  • In 2025, the turnover rate for direct selling was approximately 43.3%, compared to 45.2% in retail trade.
  • This trend persists over multiple years, with direct selling consistently exhibiting lower turnover.

Lower turnover rates suggest:

Greater Salesforce Satisfaction
Individuals engaged in direct selling may value the flexibility and autonomy offered by the model.

Stronger Retention Mechanisms
Compensation structures, community-building efforts, and personal development opportunities contribute to sustained engagement.

Collectively, these factors may indicate a stable and resilient direct selling salesforce — an essential component of long-term industry success.

Key Takeaways

  • Salesforce Strength: Lower turnover rates compared to retail indicate strong retention and workforce satisfaction.
  • Sustainable Recruitment: Recruitment trends are stabilizing, reflecting renewed interest and improved selectivity.
  • Resilience and Adaptability: The industry continues to adapt to digitalization and changing consumer preferences.
  • Flexible & Accessible Engagement: The industry continues to offer flexible opportunities, with the majority (4.8 million) participating part-time, supporting a wide range of lifestyles.
  • Expanding Customer Reach: A growing base of 34.8 million customers highlights sustained consumer interest and strong market engagement.
  • Inclusive & Evolving Workforce: The sales force remains women-led (73%), spans multiple age groups, and shows increasing diversity, with Hispanic representation rising to 26%.
  • Broad Nationwide Engagement: Multiple states demonstrate significant participation and solid revenue generation, reflecting widespread adoption.
  • Sustained Economic Impact: Consistent contributions across all 50 states highlight direct selling as a stable and valuable economic driver nationwide.

Conclusion

Overall, the direct selling channel continues to demonstrate strong adaptability, steady customer growth, and increasingly inclusive participation — with women and Hispanic sellers playing a central and expanding role — reinforcing its position as a flexible and accessible pathway to entrepreneurship for a diverse population.

The channel continues to demonstrate regional leadership, broad nationwide participation, and consistent economic impact based on data presented in the Economic Impact of Direct Selling in the United States report, further amplified by the influence and engagement of female and Hispanic salesforce segments. Together, these factors reinforce its importance as a thriving and impactful channel across the United States.


Monica Wood is the Vice President of Consumer and Member Insights at Herbalife and Chair of the DSEF Industry Research Committee.


The Economic Impact of Direct Selling Activity in the United States

By Robert A. Peterson, PhD

Introduction

Direct selling is a business model that offers entrepreneurial opportunities to individuals who, as independent contractors, market products and services to consumers, typically outside of a fixed retail establishment through one-to-one selling, in-home product demonstrations, or online. Direct sellers have job titles such as distributor, representative, consultant, associate, or brand partner. They may participate in direct selling in various ways, including selling products and services themselves or through their sales organizations, providing training and leadership to their sales organizations, referring customers to their company, and purchasing products and services for personal use. Compensation is ultimately based on sales and may be earned through personal sales and/or the sales of others in their sales organization.

In 2024, direct selling generated $34.7 billion in retail sales in the United States and involved an estimated 5.4 million individuals who were actively engaged in building their own direct selling businesses.

Despite its ubiquity and contribution to the economy, the full economic impact of direct selling in the United States is often understated. Therefore, the purpose of the present analysis was to estimate the economic impact of direct selling activity in 2024 through the application of an input-output economic model. Given the retail sales generated by direct selling (i.e., its Direct Effect), the model (implemented by means of IMPLAN® software and data) estimated the

  • Indirect Effect (upstream or supply chain sales) due to direct selling and
  • Induced Effect (downstream sales due to household spending) associated with the Direct and Indirect Effects.

Collectively, these three effects—Direct, Indirect, and Induced—represent the economic impact of direct selling activity on the nation’s economy. In addition, the analysis estimated the fiscal (tax) implications of direct selling activity in the United States.

Executive Summary

An input-output economic modeling of 2024 direct selling sales activity was undertaken using IMPLAN® software and data obtained from the federal government[1]. Direct selling (retail) sales data were provided by the Direct Selling Education Foundation (DSEF). The purpose of the modeling was to estimate the economic impact of direct selling activity in the United States in 2024.

Results are reported in terms of Direct, Indirect, and Induced Effects using a measure of gross economic output, sales dollars. Gross economic output refers to the cumulative value of production. Unlike Gross Domestic Product (GDP), gross economic output includes intermediate goods and services. (GDP is synonymous with total output less intermediate inputs.)

Using the DSEF estimate of $34.7 billion in direct selling (retail) sales in 2024 as a starting point, the total economic impact of direct selling activity in the United States in 2024 was estimated to be $79.2 billion. The $79.2 billion economic impact consisted of

  • The Direct Effect of direct selling, $34.7 billion
  • The Indirect (upstream or supply chain) Effect of direct selling, $19.9 billion, and
  • The Induced (downstream or household) Effect of direct selling, $24.6 billion.

Because of (1) the modeling approach and (2) the nature of the industry (e.g., the widespread use of independent contractors), the total estimated economic impact of $79.2 billion should be considered conservative.

The derived multiplier emanating from IMPLAN® modeling was 2.28. This multiplier means that nationally $1.00 in direct selling (retail) sales produced an economic impact of $2.28 in 2024.

In 2024, the economic impact of direct selling activity produced an estimated $6.5 billion in federal taxes and $4.9 billion in state and local taxes, or $11.4 billion in total taxes. The total value of direct selling activity (i.e., the Direct, Indirect, and Induced Effects) added to the nation’s Gross Domestic Product in 2024 was estimated to be $79.2 billion.

Overview and Methodology

The present modeling estimated the economic impact of direct selling activity in the United States in 2024 using the IMPLAN® input-output economic model. Specifically, in the present context, gross economic activity refers to sales dollars generated and distributed throughout the United States economy. The sources of activities that sum to economic output consist of both capital expenditures and operating expenditures, including spending on goods and services by direct selling firms, the Direct Effect, as well as by firms within the direct selling supply chain, which leads to the Indirect Effect, and off-site spending on goods and services by households in which a member earns income from a direct selling company or supply chain company, the Induced Effect.

A series of multipliers link Direct, Indirect, and Induced Effects. These multipliers are based on data compiled by several federal entities and include the Bureau of Economic Analysis Benchmark Input-Output Tables. (See Appendix for details.) A summary metric, the derived or implied direct selling multiplier, estimates the impact of one direct selling sales (retail) dollar on gross economic output due to inter-industry and industry-employee household relationships between the direct selling industry and other industries.
Conceptually, the multipliers quantify the economic ripple effect of inter-industry economic activity. This ripple effect can be positive or negative depending on whether a modeled entity is expanding or contracting. Multipliers are static and do not account for disruptive shifts in infrastructure without specifically addressing infrastructure changes. The present model applies the most current (2024) IMPLAN® multipliers.

Data

DSEF conducts an annual “Growth & Outlook” market-sizing survey to estimate the size and scope of the direct selling industry in the United States. It engages Cadmus, an international consulting firm, to conduct this survey, perform secondary research, and generate industry-wide estimates.

Cadmus market-sizing estimates are reviewed and further refined by DSEF. Results that are reported include total direct selling (retail) sales as well as (retail) sales estimates by selected geographical regions, by compensation structure of direct selling firms, by sales strategy, and by major product categories. The six product categories utilized in the present analysis are:[2]

  • Wellness—Weight management products and programs, nutritional supplements, sports/energy and body-building, health foods and beverages, children’s supplements, health/nutrition/fitness instructional materials, and essential oils and pharmacy.
  • Services—Financial services, telecommunications, internet services, energy, legal services, group buying, and travel services.
  • Home and Family Care and Home Durables—Home and auto care cleaning products, and food and beverages (excluding those in the wellness category). Home durables includes cookware, cutlery, house/kitchenware, various home gifts, and home appliances.
  • Personal Care—Cosmetics, skin care, fragrances, hair and nail care, and various toiletry products.
  • Clothing and Accessories—Clothing, lingerie, sleepwear, shoes, jewelry, and fashion accessories.
  • Leisure and Educational—Books, encyclopedias, educational publications, computer software, crafts, and toys and games.


The DSEF’s 2025 Growth & Outlook Report (retail) sales estimate formed the basis of IMPLAN® modeling. Specifically, according to the DSEF, direct selling (retail) sales totaled $34.7 billion in 2024. The $34.7 billion in direct selling (retail) sales was initially modeled in IMPLAN® with margins applied. This was equivalent to identifying the economic impact of operating a business with $34.7 billion in retail sales. It excluded the manufacturing, wholesaling, and transporting of goods, and included only the economic activities associated with direct selling companies.

Wholesaling and manufacturing Indirect Effects of direct selling activity due to the industry supply chain were sequentially modeled by respectively applying margins to direct selling (retail) sales activity and wholesale sales activity. For wholesaling, this allowed the identification of the economic effects of operating the equivalent of a wholesale business. The wholesale industry modeling included transportation but excluded the effect and supply chain of the manufacturing component.

Manufacturing activity was estimated after applying margins to and subtracting direct selling economic activity and wholesaling economic activity. Manufacturing sales activity was modeled using the six product groups (e.g., wellness, personal care, etc.) above.

The Induced Effect of direct selling activity was estimated for each sector modeled (i.e., retailing, wholesaling, and manufacturing) and aggregated to reflect its total estimated economic impact.

Taxes attributable to direct selling activity were also estimated using the IMPLAN® model. The tax estimates provided in this report include tax revenue derived from direct, indirect, and induced sales activity. The national economic impact tax estimate includes both federal taxes and state/local taxes.

Economic Impact

The $34.7 billion in direct selling (retail) sales nationally contributed a total economic impact of $79.2 billion to the national economy in 2024 through its combined indirect and induced effects. As shown above, the 2024 national economic impact included $34.7 billion in direct selling sales activity, $19.9 billion in indirect sales activity, and $24.6 billion in induced sales activity.

The derived (implied) multiplier resulting from IMPLAN® modeling summarizes the economic impact of one direct selling (retail) sales dollar ($1) on the national economy. It is calculated as the total economic impact divided by the direct effect (i.e., $79.2B/$34.7B = 2.28 in 2024). Thus, for example, $1 in direct selling sales (the direct effect) generated a total economic impact of $2.28 in 2024. The derived multiplier in 2024 is somewhat smaller than derived multipliers observed in other retailing sectors (approximately 2.44 on average).

Fiscal Impact

Tax impacts estimated by IMPLAN® are respectively categorized as federal taxes and state and local taxes. IMPLAN® quantifies tax impacts based on employee compensation, proprietor income, and taxes on production and imports, households, and corporations. Estimated taxes range from federal and state income taxes and property taxes to sales taxes and motor vehicle licenses. As such, the estimated total (direct, indirect, and induced) federal, state, and local tax revenues attributable to direct selling activity in the United States in 2024 were $11.4 billion. Federal tax revenues attributable to the $34.7 billion in direct selling activity were estimated at $6.5 billion in 2024. State and local taxes attributable to direct selling activity were estimated at $4.9 billion in 2024.

About IMPLAN®

IMPLAN® is an input-output economic model based on aggregating and connecting a multitude of economic databases, foremost of which are the Bureau of Economic Analysis (United States Department of Commerce) Benchmark Input-Output Tables.[3] It consists of both software and data that together permit detailed estimates of various economic impacts. The IMPLAN® model quantifies inter-industry relationships within an economy by documenting how the output of one industry becomes the input of another industry. Through a backward-linking process, the present modeling captured the relationship between economic activity in the direct selling industry and economic activity in its (general) supply chain (i.e., the Indirect Effect of direct selling activity on the wholesaling and manufacturing firms in the direct selling industry supply chain) as well as the ancillary (household) effect that direct selling activity has on the economy (i.e., the Induced Effect).

The primary databases contained and used in IMPLAN® modeling are respectively compiled and updated by the United States Census Bureau, the United States Bureau of Economic Analysis, the United States Department of Agriculture, and the United States Bureau of Labor Statistics.

Numerous multipliers were used in the present analysis to link the six (aggregated) product categories and the manufacturing sector (which were in turn linked to the wholesale and retail sectors). In particular, product subcategories were matched with 6-digit NAICS codes which were in turn linked to their respective 528 IMPLAN® sectors. Because the Nonstore Retailers Sector encompasses more establishments than those traditionally defined as direct selling companies, its associated multiplier might be somewhat attenuated. However, any possible attenuation was not believed to substantially affect the results of the estimation process or the final economic impact estimation due to limiting the modeling to particular product categories.

Specifically, when modeling the manufacturing sector, the multipliers associated with the six direct selling product categories incorporated the categories’ relative sales and the percentage of category manufacturer sales that originated in the United States (based on federal data sources). The 2024 direct selling (retail) sales percentages were based on the DSEF’s 2025 Growth & Outlook Report estimates, whereas the 2024 domestic purchasing percentages (related to local purchasing coefficients in IMPLAN®) were based on 2023 federal statistics.

Within the six product categories, subcategories were aggregated to form each respective product category. For instance, as previously shown, two IMPLAN® subcategories (Clothing, Lingerie, Sleepwear and Shoes, and Jewelry and Fashion Accessories) were aggregated to create the Clothing & Accessories product category. Trade flows and industry data for the subcategories were combined in IMPLAN®, and multipliers were generated by IMPLAN® software. (Note: the combination was not a simple average.) To the extent that product category data do not comport exactly with direct selling product offerings or sales, the multipliers might be somewhat attenuated. However, the consequence of such potential attenuation was not deemed substantial.

The overall derived multiplier, 2.28, was composed of the Direct Effect implied multiplier 1.00, the Indirect Effect implied multiplier .57, and the Induced Effect implied multiplier .71.

Where appropriate, default values of the IMPLAN® software were applied during modeling. Consequently, all estimated values—multipliers as well as effects and impacts—should be considered conservative.

[1] IMPLAN® is widely used in industry and government analyses. See www.implan.com
[2] The product categories include, but are not limited to, the illustrative subcategories.
[3] Frances Day, “Principles of Impact Analysis & IMPLAN® Applications.” IMPLAN® stands for IMpact Analysis for PLANning.


Dr. Robert Peterson is Professor Emeritus of Marketing and John T. Stuart III Centennial Chair of Marketing (Emeritus) at The University of Texas.

References

  • Direct Selling Education Foundation. 2025 Growth & Outlook Report.
  • IMPLAN Group, LLC. IMPLAN® 2023. Huntersville, NC. IMPLAN.com.
  • Robert A. Peterson. The Economic Impact of Direct Selling Activity in the United States in 2016.
  • Robert A. Peterson. The Economic Impact of Direct Selling Activity in the United States in 2022.
  • United States Bureau of Economic Analysis. Real Gross Domestic Product, Chained Dollars, bea.gov.
  • United States Bureau of Economic Analysis. Personal Income and Its Disposition, Monthly, bea.gov.
  • United States Census Bureau. Retail and Food Services Sales, census.gov.
  • United States Census Bureau. Nonemployer Statistics by Legal Form of Organization and Receipts Size Class for the United States, States, and Selected Geographies, census.gov.

Acknowledgment

Appreciation is expressed to the Business Research Division, Leeds School of Business, University of Colorado, Boulder, for its analytical support.

Direct Selling Today: Storied Companies and Brands, Millions of Entrepreneurial Americans

By Monica Wood

Direct selling is a go-to-market strategy that is an alternative channel to retail. Individual independent distributors market and sell products and services to consumers in direct selling. The channel allows companies to reach customers through personalized interactions rather than relying on traditional storefronts. It also offers distributors flexible earning opportunities by building relationships and leveraging word-of-mouth marketing.

Some of the world’s most storied companies and recognizable brands market today’s leading-edge products through the direct selling channel – these include jewelry, cookware, nutritionals, cosmetics, housewares, energy, insurance, and much more. By leveraging direct selling, these companies create a more personalized customer experience that highlights product benefits in real-world settings. This approach also allows brands to expand their reach through trusted relationships and community-based engagement rather than traditional retail environments.

The direct selling channel differs from broader retail in how it gets great products and services into the hands of consumers. It’s an avenue where entrepreneurial-minded Americans can represent the products they love, while they work independently to build a business on their own terms. This personalized model allows consumers to engage with products through trusted, one-on-one interactions that traditional retail rarely provides. It also empowers individuals to turn their passion into income by building customer relationships and growing their business at their own pace.

Consultants forge strong personal relationships with prospective customers, primarily through face-to-face discussions and demonstrations. In this age of social networking, direct selling is a strategy that many marketers of consumer products find more effective than traditional channels. By combining personal interaction with digital outreach, consultants can create a seamless customer experience that builds trust and engagement. This hybrid approach allows brands to reach consumers where they are—both online and in their communities—while maintaining the authenticity and connection that drive purchasing decisions.

Millions of Americans from every state, congressional district and community in the United States choose direct selling because they enjoy a company’s products or services and want to purchase them at a discount. Some decide to market the products they love to friends, family, and others and earn commissions from their sales. The most successful consultants may decide to expand their businesses by building a network of direct sellers. This model allows individuals to grow at their own pace, whether they simply want to save money or aspire to build a business. As a result, direct selling attracts a broad mix of people who value flexibility, community, and the ability to shape their own economic futures.

Ninety-two and a half percent of direct sellers decide to work part-time, offering busy parents, caregivers, military spouses, veterans, and others flexibility and work-life balance. As advancements in technology create a new American economy whose foundation is built upon the entrepreneurial spirit and independent work, historically, direct selling has been one of the oldest ways millions of Americans have chosen to work independently—long before the advent of the Internet. Direct selling has a long history of substantially contributing to the economy and supporting the millions of Americans involved.

Its adaptability has enabled the direct selling channel to remain relevant through changing economic conditions, technological evolutions, and shifting consumer behaviors. This longstanding resilience underscores the sector’s role as a reliable pathway for individuals seeking autonomy and economic opportunity.

$34.7 Billion in Retail Sales and 5.4 Million Direct Sellers
Salesforce make up: Direct Sellers, Discount buyers, preferred customers

5.4 million direct sellers have built a full-time business (30 or more hours/week) or part-time (fewer than 30 hours/week) representing a correction after the hypergrowth of the pandemic. These people sell products/services to consumers and may sponsor people to join their team.

34.3 Million Preferred Customers/Discount Buyers

6.8 million Discount Buyers are eligible to purchase, sell and sponsor but currently only purchasing products and services they personally enjoy and receive at a discount.

27.5 million Preferred Customers have signed a preferred customer agreement with a direct selling company where they may be entitled to pay wholesale prices for products and services but are not eligible to sell.

Demographics by gender-27% male and 73% female

Demographics in 2024: Women, Hispanic participation other highlights

The demographic data show that the direct selling population is predominantly female, with women representing 73% of participants, and most individuals fall within the 35–54 age range. Participation spans all age groups, indicating that direct selling appeals to both younger adults seeking flexibility and older adults pursuing supplemental income.

Demographics by raceWhen considering direct seller ethnicity, 19% of participants identify as Hispanic, reflecting meaningful engagement from a key and growing demographic segment.
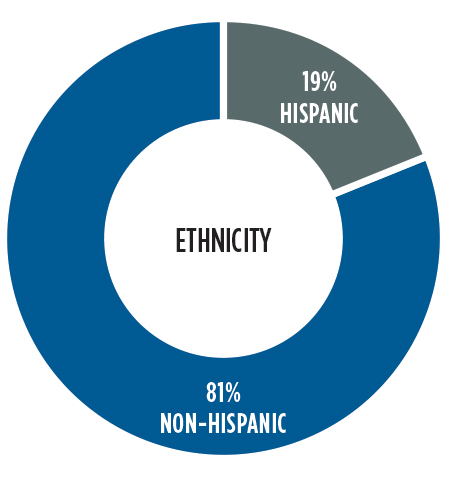
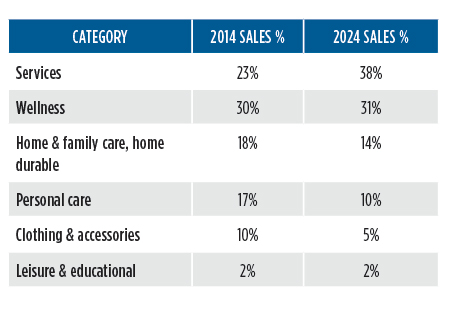
Sales by Category (2024)

The 2025 Growth & Outlook survey results indicate that service-based offerings have experienced substantial growth and now represent the largest share of sales, highlighting strong consumer interest in digitally enabled and value-added services. Wellness products continue to maintain a significant portion of the market, demonstrating their enduring appeal. Meanwhile, the gradual shifts in product-oriented categories—such as personal care, home and family care, clothing, and leisure—represent opportunities for companies to innovate, reposition their portfolios, and meet emerging consumer preferences more effectively.

State Breakdown of Retail Sales/Salespeople by State (2024)

12.2 million people in the U.S. signed or renewed independent contractor sales agreements with direct selling companies in 2024. Of these 12.2 million, 5.4 million worked to build businesses and 6.8 million were discount buyers who purchased products for their own use but chose not to build a business. These estimated direct sales and people-involved figures are extrapolated based on 2025 Growth & Outlook Survey data submitted directly from DSA members.

State/Territory People Involved in Direct Selling Retail Sales
Alabama 120,971 $446M
Alaska 69,150 $162M
Arizona 231,808 $620M
Arkansas 116,320 $362M
California 1,285,088 $3.9B
Colorado 276,515 $626M
Connecticut 96,649 $284M
Delaware 35,730 $127M
Florida 827,479 $2.2B
Georgia 396,711 $1.1B
Hawaii 53,605 $85M
Idaho 103,444 $246M
Illinois 425,529 $1.2B
Indiana 309,809 $857M
Iowa 204,866 $647M
Kansas 133,993 $353M
Kentucky 142,370 $404M
Louisiana 134,146 $465M
Maine 64,641 $187M
Maryland 195,114 $531M
Massachusetts 140,495 $434M
Michigan 359,404 $0.9B
Minnesota 266,638 $714M
Mississippi 130,921 $616M
Missouri 194,361 $492M
Montana 68,031 $160M
Nebraska 117,414 $344M
Nevada 107,862 $266M
New Hampshire 84,186 $226M
New Jersey 257,016 $762M
New Mexico 81,552 $213M
New York 591,642 $1.9B
North Carolina 410,045 $1.1B
North Dakota 61,152 $188M
Ohio 416,559 $1.0B
Oklahoma 191,781 $459M
Oregon 142,972 $418M
Pennsylvania 395,806 $1.0B
Rhode Island 35,506 $111M
South Carolina 182,085 $470M
South Dakota 66,977 $201M
Tennessee 248,566 $758M
Texas 1,219,347 $3.6B
Utah 190,869 $514M
Vermont 19,937 $72M
Virginia 282,753 $706M
Washington 226,305 $611M
West Virginia 62,501 $175M
Wisconsin 278,227 $816M
Wyoming 39,040 $90M
District of Columbia 8,464 $18M
Guam 7,006 $8M
Puerto Rico 63,550 $544M
U.S. Virgin Islands 1,458 $6M
N. Marian Islands 14 $15M
American Samoa 171 $0.2M
Overseas U.S. Military 4,421 $14M

Looking Forward: What Consumers Think

The direct selling channel remains a viable and strategically significant avenue for companies that prioritize innovation and align their offerings with contemporary consumer expectations. The increasing integration of artificial intelligence is improving the training, development, and empowerment of prospective sales representatives, thereby fostering heightened entrepreneurial engagement across the sector. The continued emphasis on product quality and meeting consumer needs is critical to establishing a strong foundation for sustainable growth. Additionally, as consumer preferences evolve in a dynamic marketplace, opportunities for long-term competitiveness within the direct selling landscape are likely to increase.


Key findings from DSEF 2024 Consumer Attitudes Study – trends moving in Direct Selling’s direction

Entrepreneurial trends show an increase in participation in activities like direct selling, gig work, and online selling. The number of respondents working as direct sellers has tripled since 2008, with 1 in 3 expressing specific interest in the direct selling opportunity.

Key attributes that draw consumers to direct selling include the opportunity to support local businesses, access to distinctive products, and engagement with knowledgeable sellers. Social media continues to serve as an important mechanism for direct sellers to reach prospective customers, despite a decline in its perceived usefulness for maintaining connections and staying informed.

Overall, the study reflects a growing interest in flexible work arrangements, including direct selling. In an effort to enhance its appeal, the channel might consider further leveraging its strengths—such as personalized service, unique product offerings, and a strong sense of community.


Monica Wood is the Vice President of Consumer and Member Insights at Herbalife and Chair of the DSEF Industry Research Committee.

Breaking Down The FTC’s Updated Business Guidance Concerning Multi-Level Marketing and Income Disclosure Statements

By Branko Jovanovic and Monica Zhong[1]

Ensuring that direct sellers’ Income Disclosure Statement (“IDS”) reliably and accurately reflects the actual experience of a typical distributor has long been the FTC’s requirement. On April 30, 2024, the FTC published updated Business Guidance Concerning Multi-Level Marketing (“2024 Guidance”)[2] that details the current principles and practices that the FTC considers in its assessment of whether an MLM is offering an unlawful compensation structure and operating as a pyramid scheme. While the FTC continues to emphasize that representations about income opportunities should reflect the earnings of a typical distributor[3] and that any income claims must be based on reliable empirical evidence,[4] the 2024 Guidance outlines a number of requirements regarding what constitutes deceptive earnings.

Following the release of the 2024 Guidance, on September 4, 2024 the FTC published a staff report titled “Multi-Level Marketing Income Disclosure Statements” (“Staff Report”).[5] The Staff Report “documents an analysis of 70 publicly available income disclosure statements from a wide range of MLMs”[6] and shows that many of the reviewed income disclosure statements: “(a) present income data that does not take account of participants who made little or no income, often without clearly explaining the limitation; (b) do not account for expenses incurred by participants, often without clearly stating the limitation; (c) emphasize high dollar amounts received by a relatively small number of participants; (d) do not include information about the limited income that most participants receive, or provide this information only inconspicuously; and (e) use terms and present income data in potentially confusing or ambiguous ways.”[7]

In this paper we discuss, from an economic standpoint, several ways for MLMs to adapt their income and earnings reports (which are typically in the form of IDSs) to be better aligned with the 2024 Guidance and to alleviate some of the criticism levied in the Staff Report. While these adaptations generally require direct sellers to adopt conservative measures of participants’ earnings and treat the IDS as a risk management tool, we are cognizant of a potential tension between this approach and the IDS as a marketing tool meant to attract potential participants.

Defining “I” in the IDS

The Staff Report notes that “none of the reviewed income disclosure statements clearly explains what data is being presented to consumers. They prominently state that they are sharing information about ‘income’ and ‘earnings,’ but do not conspicuously explain what the terms mean.”[8] Furthermore, the Staff Report states that “nearly every disclosure statement uses prominent headings that describe the data provided as ‘income’ or ‘earnings’ without further qualification” and that “terms such as ‘earnings’ can mean different things in different contexts.”[9]

As recognized in the Staff Report, the IDS generally captures the amount of money the direct seller paid to participants, including commissions, bonuses, overrides, and awards.[10] While retail sales are recognized as a potentially significant source of earnings for distributors, the IDSs typically do not report retail profits because direct sellers usually do not track distributors’ sales to final customers.[11] Including these retail profits in the IDS would not only improve the document’s accuracy but could also potentially make the IDS more attractive to potential participants.

Capturing Participants’ Costs

Perhaps the most important requirement that the 2024 Guidance repeatedly insists upon is that “claims about earnings should take into account both what participants earn and what they spend.”[12] In particular, expenses, such as costs for product purchases, travel for conferences, tools or services, and training, must be subtracted from any revenue earned to determine whether the participant has made a profit or lost money.[13]

While the FTC insists that the IDS ought to account for all costs incurred by individuals pursuing the business, currently, IDSs generally do not disclose or quantify business expenses incurred by the typical distributor that reduce their net earnings.[14] These expenses fall into two broad categories: those observable in the companies’ business intelligence (distributor-level) data, and those that are generally unobservable.

The observable expenses include direct expenses (fees for registration and renewal, fees for distributor websites, marketing and sales aids, etc.) and expenses associated with enrollment and rank/eligibility maintenance. Direct expenses can generally be assessed using company-wide data and/or the data on distributor-level purchases (often referred to as order-line data).[15] Some typical and recurring expenses, such as general enrollment costs and costs to attend mandatory training or conferences, can be inferred from company-wide data. However, this data usually cannot capture the disparity in costs incurred by individual participants, as some may meet different enrollment requirements. The order-line data on the other hand, can track participant-specific expenses associated with enrollment (including starter kits and any administrative fees) and eligibility maintenance (minimum purchase requirements). While these costs are relatively easy to identify in the data, their treatment is less clear because they generally provide the purchaser with some consumption value and incorporating them into the IDS could overstate distributors’ expenses.

Unobservable, distributor-specific expenses can include the cost of setting up and maintaining the business, as well as the cost of travel to conventions and other events. While business intelligence and order-line data provide little information on these expenses, a well-designed and executed survey could shed some light on these costs.

Challenges Associated with Reporting Typical Earnings: Projections and Extrapolation

The 2024 Guidance explicitly states that “[t]he IDS should not misrepresent participant earnings, including by annualizing or projecting income that was not actually earned by a participant in the time period the IDS covers.”[16] This requirement addresses the treatment of distributors who did not participate throughout the period covered by the IDS.

To understand this requirement, consider a simple example: A distributor joined a direct selling company in June and earned $25 in November and $75 in December for a total of $100. Annualizing this distributor’s earnings (i.e., stating that this distributor would have earned $1,200), or using the distributor’s average monthly earnings ($50) to impute this distributor’s earnings for each month of the period covered by the IDS would likely be seen as deceptive by the FTC.[17]

Consider also a scenario where distributor A earns $50 each month for the first six months and nothing afterward, and distributor B earns $50 each month for the last six months, and nothing in the first six months. If the average monthly earnings are calculated ignoring the zero-earning months, the average monthly earnings would be $50 for each month, and the annual average earning would be $600 (the sum of the average monthly earnings). Essentially, the average monthly earnings would be extrapolated for the months where distributors A and B had no earnings, leading to a 100% overstatement of the annual average earnings.[18]

Challenges Associated with Reporting Typical Earnings: Exclusion of Certain Categories of Participants

The Staff Report states that “most of the income disclosure statements reviewed do not depict the distribution of income across all participants, but instead present a distribution that excludes certain groups of participants.”[19] The exclusion of certain categories of participants when reporting typical earnings is a common practice among direct selling companies and is not necessarily a form of deception; every direct selling company has some participants who merely signed up to receive a discount on the company’s products and have no interest in selling the company’s products or building a business. These participants are often merely end-user consumers, who will earn little to no income from the company; including these participants in the earnings report deflates the typical earnings across all distributors.[20]

However, excluding such distributors risks allegations that the IDS artificially inflates earnings by including only those distributors who have achieved some degree of success.[21] Indeed, the 2024 Guidance explicitly states that “excluding the participants who lost money or earned no money, who failed to qualify for bonuses or commissions, or who are considered ‘inactive’ because they didn’t get any compensation or qualify for a certain type of compensation during a particular time period, is misleading.”[22]

To illustrate the effect of exclusion of certain categories of participants when reporting typical earnings, consider the following example: A distributor purchases every month, meets the minimum purchase requirement in 10 months, and earns in three months only. The FTC would likely find that the IDS that calculates this distributor’s earning over either 10 months in which the minimum purchase requirement was met, or three months when this distributor earned as an active distributor (those who by definition of the compensation plan are eligible to receive earnings) is deceptive.

Characterizing Distributor Earnings

The 2024 Guidance states that if “the MLM or participant does not have a reasonable basis to know what the typical person in the group is likely to achieve in earnings, they should not make any earnings claims, including lifestyle claims.”[23] In particular, the FTC states that “if they are atypical, then discussion of those atypical earnings must be accompanied, at a minimum, by a clear, prominent, and unavoidable presentation of the typical participant’s revenue and expenses.”[24]

Further, the FTC also explicitly states that in order to make any claim of “modest or supplemental income,” the MLM needs to obtain information on the typical net earnings of participants and establish the exact definition of what “modest and supplemental income” represent to consumers.[25] In essence, this requirement seems to ask that a direct seller conducts an annual survey that would establish the participants’ perception of the terms “modest” and “supplemental” income. However, given the FTC’s general skepticism of survey evidence, it is unclear what type of analysis would be considered sufficient to establish the meaning of these two terms.

Measuring the Typical Distributor’s Earnings

While the 2024 Guidance does not specify the correct metric for measuring the typical distributor’s earnings, the Staff Report appears to endorse the use of “median reported income,”[26] the value separating the higher half from the lower half of distributors in terms of their earnings. As there may be wide variation in how much distributors earn within a rank, simply calculating the arithmetic mean tells potential distributors little about how much a typical distributor at that rank earned.[27] Therefore, applying the median may more accurately capture the typical distributor’s earnings and is less sensitive to extreme values.[28]

Although the earnings and the rank of a single distributor may change dramatically within the period covered by the IDS, parsing their experience by rank and ignoring their overall experience during the relevant period may not speak to the experience of a typical distributor. The Staff Report is critical of such parsing and appears to endorse an alternative approach where the experience of distributors who may have held different ranks during the relevant period may be better captured by reporting the median earnings by the highest rank they achieved in that period.[29]

Presentation of Information Should Not Give Misleading Impressions

The Staff Report suggests that earnings metrics presented in a way that appears to highlight the experience of a small percentage of distributors who achieve high earnings and downplays the experience of a large percentage of distributors who earn relatively modest amounts, if anything at all, will be considered misleading.[30] The Staff Report noted that nearly all of the reviewed IDSs devote most of the visual space in the tables to high income earned by the very small number of participants in the higher ranks or specific percentages of participants at the top of the income scale.[31] This implies that for direct selling companies that feature a relatively high number of unique ranks, the income disclosure tables may be more susceptible to FTC allegations of emphasizing a small number of participants with high income.[32]

The Staff Report also critiques that reference and display of important income information in many reviewed IDSs are in a “less prominent or conspicuous manner.”[33] While the Staff Report points to the use of “prominent unqualified headings” and “less prominent” disclaimers (in fact, the word “prominent” is used on nearly all pages of the report),[34] the report is unclear as to the exact standards the FTC uses to determine whether the display feature is more or less “prominent” in the context of IDSs. However, the Staff Report seems to suggest that actions such as listing out income information as additional rows in the income distribution table and displaying all information in “proximate, equally-prominent text” is considered as prominent disclosure.[35]

Conclusion

Given the complexity associated with preparing an IDS that would meet the FTC’s requirement, direct sellers may wonder whether to publish the IDS at all. After all, the FTC states that “if an MLM is not a ‘Business Opportunity,’[36] it is not required to give any information about earnings to potential participants, but any earnings information it does give must be truthful, substantiated, and non-misleading.”[37] However, if direct sellers opt not to publish an IDS, their distributors cannot make any earnings claims at all—no matter how truthful. Companies must balance the reality that distributors demand and need a voice to speak about their actual experience with the business and the need to create a truthful and accurate IDS.

While IDSs are intended to be an accurate estimate of the earnings participants can generally expect by engaging with the MLM’s business, we note that there is no disclosure “preferred for all consumers,”[38] and that each individual company’s unique compensation structure will be reflected in its IDS.

[1] Branko Jovanovic is a partner and Monica Zhong is a principal consultant at Edgeworth Economics. The opinions expressed are those of the author(s) and do not necessarily reflect the views of their employer and its clients. This article is for general information purposes and is not intended to be and should not be taken as legal advice.

[2] FTC, “Business Guidance Concerning Multi-Level Marketing,” April 30, 2024, available at https://www.ftc.gov/business-guidance/resources/business-guidance-concerning-multi-level-marketing.

[3] See the 2024 Guidance, question 13: “Any earnings claim should reflect what the typical person to whom the representation is directed is likely to achieve in income, profit, or appreciation.”

[4] See the 2024 Guidance, question 13: “An MLM or participant making claims about MLM income must have a reasonable basis for the claims disseminated to current or prospective participants about the business opportunity at the time it makes the claims. A ‘reasonable basis’ means reliable, empirical evidence that supports the claim, not subjective beliefs or personal anecdotes.”

[5] FTC, “Multi-Level marketing Income Disclosure Statements,” September 4, 2024, available at https://www.ftc.gov/system/files/ftc_gov/pdf/mlm-ids-report.pdf.

[6] Karen Hobbs, “FTC staff report analyzes 70 MLM income disclosure statements,” September 4, 2024, available at https://www.ftc.gov/business-guidance/blog/2024/09/ftc-staff-report-analyzes-70-mlm-income-disclosure-statements?utm_source=govdelivery.

[7] Staff Report, p. 28.

[8] Staff Report, p. i and footnote 8.

[9] Staff Report, p. 19.

[10] Staff Report, footnote 8.

[11] The Staff Report notes that “14 of the 70 income disclosure statements include a disclosure that the amounts represented do not include retail income—that is, when a participant purchases a product from the MLM at a discount and then resells it (presumably at a higher price). Most of the disclosure statements give no indication that such a revenue source has been omitted, and a few expressly state that they include retail income.” Staff Report, p. 19.

[12] The 2024 Guidance, question 13. The Guidance further states that for any direct sellers deciding to publish an IDS, either because they elect to do so or because they offer a “Business Opportunity,” the income and earnings information these direct sellers disclose to current or prospective participants should truthfully consider both participants’ income and typical expenses. See the 2024 Guidance, question 24.

[13] See the 2024 Guidance, question 13. Note that the FTC’s response to question 14 states that “[i]f an MLM or MLM participant does not have access to data showing what participants typically spend pursuing the business opportunity (e.g., product or service purchases, website fees, party costs, and training or conference expenses), they should refrain from making any earnings claims.” In response to question 23, the FTC states that “[i]f an MLM does not have evidence of the typical earnings of its participants (including any costs that its typical participants incur), it should refrain from making any earnings claims and ensure its participants do the same.” The Staff Report notes that “none of the 70 income disclosure statements reviewed provides income figures that take into account all expenses.” Staff Report, p. 12.

[14] Note that Noland Court observed that “[a]ffiliate witnesses did not carefully track (and, in some instances, did not even understand the difference between) revenues and profits.” Order In Re Federal Trade Commission v. James D. Noland, Jr. et al., In the U.S. District Court for the District of Arizona, May 23, 2023, 17:26–18:1.

[15] Even the observable expenses can be challenging to assess, especially in instances where the expenses are not readily identifiable. For example, the assessment of costs associated with sales aids may require a thorough review of product description and associated price and volume points.

[16] The 2024 Guidance, question 24. Curiously, the Staff Report reports that “[o]ne disclosure statement has a table that lists both average monthly pay and average annual pay—but the annual pay is not 12 times the monthly pay, and the table does not explain how the MLM calculated the figure” in the section titled “Unexplained Discrepancies” (Staff Report, p. 20). But this “discrepancy” simply means that monthly earnings were not annualized, recognizing that some participants enrolled in the year covered by the IDS, and that many do not earn in every month.

[17] The FTC provided the following example: “According to the complaint, when calculating a participant’s annual income, if a participant worked one year — 24 pay periods — but only earned one paycheck for $100, AdvoCare multiplied the single $100 check by 24 pay periods to calculate the participant’s ‘annual average income’ as $2,400. The FTC alleged that AdvoCare’s IDS, therefore, was deceptive in its portrayal of participant income.” The 2024 Guidance, question 24.

[18] The risk of misrepresenting the earnings of the distributors in the two scenarios above would likely be minimized by reporting monthly, instead of annual, earnings.

[19] Staff Report, p. 10.

[20] The Staff Report notes that “[t]he nature of this exclusion varies, but in at least some cases it excludes all participants who received no income as well as potentially others.” Staff Report, p. 10. The Staff Report further states that “[m]ost of the income disclosure statements do not include a prominent, express explanation of the limited nature of the income distribution depicted.” Staff Report, p. 12.

[21] A robust preferred customer program that provides appropriate incentives for individuals to self-classify upon registration gives companies a principled and defensible way to exclude from their IDS individuals who have no desire to participate in the compensation plan.

[22] The 2024 Guidance, question 24. In addition, “participants should not be omitted from earnings statistics unless the MLM has evidence that they have affirmatively opted out of the income-earning opportunity, not merely failed to qualify for it or not merely exercised any inventory buy-back program.” See the 2024 Guidance, question 24.

[23] The 2024 Guidance, question 18. The FTC repeatedly emphasizes the differentiation between typical and atypical earnings and considers it potentially deceptive if the earnings claims do not “reflect what the typical person to whom the representation is directed is likely to achieve,” including the disclaimers that “results are not guaranteed” or similar statements. See the 2024 Guidance, questions 13 and 18.

[24] The 2024 Guidance, question 18.

[25] The 2024 Guidance, question 19.

[26] Staff Report, p. 17 and footnotes 39 and 40.

[27] The Staff Report correctly notes that “while an average can be a useful summary of data that has a relatively small degree of internal variation, it can be misleading when the data is largely consistent but has a small number of outliers.” Staff Report, p. 16.

[28] Consider, for example, a situation where nine distributors earn nothing and one distributor earns $110. The arithmetic mean in this example is $11, which overstates the earnings of all but one distributor. The median equals zero, which more accurately reflects the experience of the majority of participants.

[29] Staff Report, pp. 18–19.

[30] Staff Report, p. 13.

[31] Staff Report, pp. 13–16.

[32] By reducing the number of ranks defined for high-performing participants, direct selling companies can not only potentially alleviate the risk of this criticism, but also simplify their compensation plans.

[33] Staff Report, p. 20.

[34] Staff Report, pp. i, 4, 7–11, 12, 16, 19–21, 23, 29.

[35] Staff Report, p. 21, footnote 22.

[36] Business opportunity, as defined by the Business Opportunity Rule (https://www.ecfr.gov/current/title-16/chapter-I/subchapter-D/part-437), means a commercial arrangement in which:

A seller solicits a prospective purchaser to enter into a new business; and

The prospective purchaser makes a required payment; and

The seller, expressly or by implication, orally or in writing, represents that the seller or one or more designated persons will:

Provide locations for the use or operation of equipment, displays, vending machines, or similar devices, owned, leased, controlled, or paid for by the purchaser; or

Provide outlets, accounts, or customers, including, but not limited to, Internet outlets, accounts, or customers, for the purchaser’s goods or services; or

Buy back any or all of the goods or services that the purchaser makes, produces, fabricates, grows, breeds, modifies, or provides, including but not limited to providing payment for such services as, for example, stuffing envelopes from the purchaser’s home.

[37]  The 2024 Guidance, question 23.

[38] See Miller, A. M., Snyder, S., Bosley, S. A., & Greenman, S. (2023). Income disclosure and consumer judgment in a multilevel marketing experiment. Journal of Consumer Affairs, 57(1), 92–120, at p. 95. See also Bosley, S. A., Greenman, S., & Snyder, S. (2020). Voluntary Disclosure and Earnings Expectations in Multi-Level Marketing. Economic Inquiry, 58(4), 1643–1662.

Direct Selling Under Scrutiny: Separating Fact from Fiction

High-level academic task force rebuts myths and misinformation about direct selling channel.

By Dr. Patrick Brockett, Dr. Anne C. Coughlan, Dr. Linda Ferrell, Dr. O.C. Ferrell, Dr. Linda Golden, Dr. Charles Ingene, Dr. Lou Pelton, and Dr. Robert A. Peterson

Abstract and Executive Summary

Direct selling (DS) is simultaneously a business model, a channel of distribution, and an activity engaged in by its distributors. In this paper, we provide a framework for analyzing and discuss academic research on the DS distribution model.

We focus in particular on research that develops economics-based analytic models to examine business and legal issues. This focus is motivated by the fact that analytic models are sometimes used as part of the assessment of whether a DS firm operates a legitimate DS channel or an illegal pyramid scheme. These models potentially have a significant economic impact on, and affect the outcomes of legal cases against, the affected DS firms. They may also be cited in the business press and in academic circles, influencing opinions of the viability or legality of the DS business and distribution model. It is therefore particularly important that such research be carefully grounded in sound logical and analytic bases, and that it appropriately reflect whatever key facts about the firm (or about DS in general) are relevant to the model’s scope of analysis.

We first describe direct selling as an economic activity and business model. We contrast illegal pyramid schemes with legitimate DS firms and outline the key definition of an illegal pyramid scheme. This definition is distinguished from the many possible indicia of pyramid schemes that can result from pyramid scheme operation, but do not themselves prove the existence of a pyramid scheme.

We next define and discuss various logical and analytic errors that can lead to the misdiagnosis of a legitimate DS firm as an illegal pyramid scheme operator. While many such error types are possible, we focus on four that we find to be particularly important in evaluating the analytic literature on DS and pyramid schemes:

  • The “Begging the Question” fallacy, in which the research in effect presumes the existence of a pyramid scheme through its (implicit and/or explicit) assumptions, and as an unsurprising result, concludes the existence of a pyramid scheme;
  • A variant on the “Begging the Question” fallacy in which the research effectively models a pyramid scheme through its omission and/or misrepresentation of substantive facts on which the determination of legality versus illegality depends;
  • The “Fallacy of the Converse,” in which the converse of a true if-then logical statement is incorrectly asserted to be true on the grounds that the original if-then statement is true. For example, even if the statement {if a firm operates a pyramid scheme, then one can expect to see some or all of a set of resulting indicia at some point in time} is reasonably true, it is not automatically true that the converse statement {if one observes a set of pyramid scheme indicia at some point in time, then the firm must be operating a pyramid scheme} is also true; and
  • A special case on the “Fallacy of the Converse,” in which the research ignores standard policies and protections that characterize legitimate DS firms, and therefore starts with an inaccurate premise that these policies and protections do not exist.
  • All of these modeling errors are substantive. This means that correcting any of these errors overturns the model’s results. Such a model is thus not a reliable tool to assess whether a DS firm does, or does not, operate a pyramid scheme.

We apply this framework to the analysis of a recent working paper, “The Alchemy of a Pyramid: Transmutating Business Opportunity Into a Negative Sum Wealth Transfer” by Andrew Stivers, Douglas Smith, and Ginger Zhe Jin (“SSJ”). We find that this research begs the question, omits and/or misrepresents substantive DS firm facts, and commits a fallacy of the converse by omitting consideration of standard DS firm policies that mitigate a pyramid scheme analysis.

Specifically, SSJ “begs the question” of whether or not a DS firm operates an illegal pyramid scheme by explicitly assuming a pyramid scheme in its list of “stylized assumptions” – which duplicate the conditions for a pyramid scheme defined in the Koscot case. Thus, the authors cannot deliver on their research goal of answering the question “What makes an MLM firm a pyramid?”, because they have already assumed the pyramid scheme outcome from the beginning.

Further, SSJ commits another “begging the question” error in explicitly assuming that the firm in its model commits fraud by purposefully misrepresenting the business opportunity to its prospects and distributors. Because a pyramid scheme cannot persist through time without such fraud, the authors again essentially presume a pyramid scheme outcome.

These first two critiques fully invalidate the SSJ research, whose authors state that its goal is to answer the question: “What makes an MLM firm a pyramid?” One cannot achieve this research goal by assuming a pyramid scheme as the basis for a model that then produces the inevitable result that a pyramid scheme exists.

Nevertheless, other errors further weaken the SSJ analysis. Many substantive facts about DS firms – which are important to the resolution of the model’s claimed purpose – are omitted or misrepresented. Among them are:

  • Its omission of any income sources to a distributor other than bonus awarded for mere recruitment without regard to sales (such as retail markup income or the economic benefit of personal consumption at wholesale prices);
  • Its misrepresentation of the basis on which bonus/commission income is awarded by DS firms, by assuming they are only awarded for pure recruitment;
  • Its omission of products that have market value to consumers;
  • Its omission of consideration of distributor differences on substantive dimensions that matter for the research question at hand;
  • Its omission of active choices by distributors concerning what to sell, how hard to work, how to price products for retail sale, how much to invest in training, whether or not to seek to recruit other distributors, or how much to personally consume;
  • Its misrepresentation of the DS firm’s objective as the maximization of one-period profit, with no consideration of the legal implications of the fraud it implies; and
  • Its omission of consideration of standard consumer and distributor protections offered by legitimate DS firms.
  • We discuss other substantive and technical problems with the SSJ model in Appendix B.

The SSJ paper concludes with a set of recommendations to control pyramid scheme threats. Because of the shortcomings we find in the model and analysis, we find that any such recommendations similarly rest on shaky foundations and are unreliable as cures for the question at hand.

We use our framework to offer an analysis of a subset of other economics-based analytic modeling papers in the DS area in Appendix A. We emphasize that our goal is not to argue that all such analyses are flawed. Indeed, economics-based analytic models are productively used in many applications and should continue to be applied to analyze firms’ operations, participants’ decisions, profitability, and growth. We hope that assessment of these efforts will be aided by applying guidelines for reliable and applicable scientific inquiry into various aspects of the DS distribution model. Read full paper →

Professional and Personal Benefits of a Direct Selling Experience

By Dr. Robert A. Peterson

Direct selling is simultaneously a channel of distribution and a business model that offers entrepreneurial opportunities for individuals to market and sell products and services, typically outside of a fixed retail establishment, through one-to-one selling, in-home product demonstrations, and/or online. As a distribution channel, direct selling is ubiquitous and, in 2016, touched the lives of an estimated 20.5 million Americans. Individuals are drawn to direct selling for a multitude of reasons beyond a desire to earn a living as a full-time direct seller or to earn extra money or make a special purchase as a part-time direct seller.

The research reported in this Executive Summary documents the impact of a direct selling experience on 14 business and professional skills as well as on 13 personal life skills. A substantial majority of the current direct sellers surveyed, more than three-fourths, agreed that they benefitted from their direct selling experience in terms of improved business and professional skills, and that skills gleaned from a direct selling experience transferred to their personal lives. Moreover, there were significant and positive relationships between self-perceived skill levels and self-perceptions of direct selling success and performance in a non-direct selling job. Findings regarding the impact of a direct selling experience on personal life skills in particular suggest that a direct selling experience can have a powerful influence beyond direct selling per se and, as such, can indirectly contribute to the betterment of society.

Four hundred ninety-five current direct sellers and 465 former direct sellers were surveyed for the present research. Findings from this research have several practical implications for recruiting, training, and retaining direct sellers. These findings and implications are briefly summarized below.

Reasons for Joining Direct Selling Company

Twelve (12) possible reasons why the direct sellers surveyed joined their current direct selling company were investigated.[1] The most frequently stated reason for joining a direct selling company was “I believed that the products are of such value that I wanted to share them with my friends, neighbors, and the public.” Eighty-one percent of the survey participants stated that this was a reason they joined their current direct selling company. The least frequently cited reason for joining a direct selling company was “I wanted a full-time working career;” 35 percent of the direct sellers surveyed gave this as a reason for joining their direct selling company. In general, the reasons for joining a direct selling company can be categorized as “people/social,” “financial” (income/job), and desire for a specific “product.”

The median number of reasons survey participants gave for joining their current direct selling company was seven (7). Thus, on average survey participants stated that seven of the 12 studied reasons were in fact reasons why they joined their current direct selling company. There were no substantive differences across the current direct seller segments studied regarding the number of reasons given for joining a direct selling company.

  • However, of the current direct sellers surveyed regarding their reasons for joining a direct selling company:
  • Males were more likely than females to want a full-time direct selling job (54% versus 31%).
  • Eighty-one percent of the female direct sellers stated that they wanted to purchase their direct selling company’s product(s) at a discount for themselves and/or their family versus 61 percent of the male direct sellers.
  • Fifty-seven percent of the male direct sellers were interested in the recognition that they would receive for their [sales] efforts compared to 39 percent of the female direct sellers.
  • Seventy-two percent of the male direct sellers were interested in enhancing their personal development (i.e., becoming more confident, better business-minded) through direct selling, whereas 53 percent of the female direct sellers stated such an interest.
  • No differences were observed regarding reasons for joining a direct selling company between urban and rural direct sellers, or among direct sellers who had been with their direct selling company for various time periods.
  • Proportionally more millennial direct sellers (46%) than non-millennial direct sellers (28%) joined their current direct selling company because they wanted a full-time working career. Millennials also wanted to feel more at ease in front of other people relative to non-millennials (56% of the millennials so responded as compared to 32% of the non-millennial direct sellers).

In addition, current direct sellers differed markedly from former direct sellers with respect to the number of reasons and the specific reasons given for joining a direct selling company. Whereas 35 percent of the current direct sellers stated that they wanted a full-time direct selling job, only 16 percent of the former direct sellers stated that they wanted a full-time direct selling job. This suggests that direct selling may currently be perceived as more likely to be a career option than it was in the past. Moreover, given that the demographic profile of direct sellers may be approaching that of the United States adult population, the “pool” of potential direct sellers may be expanding.

Skill Improvements Due to Direct Selling Experience

The present research examined 14 business/professional and 13 personal life skills that might be improved or fostered by a direct selling experience.[2] Survey participants were first asked whether they “strongly disagree,” “somewhat disagree,” “somewhat agree,” or “strongly agree” that their direct selling experience was beneficial in terms of improving or fostering each of the 14 business/professional skills. For example, they were asked whether they “strongly disagree,” “somewhat disagree,” “somewhat agree,” or “strongly agree” that “I improved my decision-making skills” (as a consequence of their direct selling experience).

Similarly, survey participants were asked whether they “strongly disagree,” “somewhat disagree,” “somewhat agree,” or “strongly agree” that they had been able to transfer each of 13 skills emanating from their direct selling experience to their personal lives. An example of these skills is “I enhanced my critical thinking ability.” Seven of the skills investigated were included in both the business/professional and personal skill sets studied.

On average, more than three-fourths of the current direct sellers surveyed somewhat or strongly agreed that both their business/professional skill levels improved and that their personal lives benefitted due to skills emanating from their direct selling experience. Consequently, in an absolute sense the current direct sellers surveyed believed that “lessons learned” through their direct selling experience were helpful in both their business/professional careers and their personal lives. Across the seven skills that were common to the business/professional and personal life skill sets, survey participants indicated that the skills they acquired from their direct selling experience were slightly more beneficial to their personal lives than to their business/professional careers.

Even so, despite the high absolute level of overall agreement that a direct selling experience improved or fostered skill levels, perceptual differences did occur between male and female direct sellers. With respect to business/professional skills that were believed to have been improved due to a direct selling experience, proportionally more male direct sellers than female direct sellers believed that their sales skills had improved (88% versus 77%) and that they undertook more [business-related] initiatives (87% versus 73%).

With respect to skills applicable to a direct seller’s personal life, self-perceptions of the eight skills listed below significantly differed between male and female direct sellers, with male direct sellers proportionally more likely than female direct sellers to believe that improvements in the eight skills studied occurred because of their direct selling experience:

  • Enhanced critical thinking ability (88% versus 74%)
  • Better at coping with and managing stress (85% versus 69%)
  • Better at problem solving (90% versus 76%)
  • Feel more at ease in front of an audience (84% versus 71%)
  • Better at time management (87% versus 77%)
  • Improved entrepreneurial skills (90% versus 78%)
  • Improved decision-making (87% versus 78%)
  • Better at managing finances (83% versus 73%)

Differences between male and female direct sellers with respect to their reasons for joining a direct selling company and the skill levels gained from a direct selling experience suggests a variety of managerial implications. Additional research is required to understand motivations underlying said differences as well as their implications. For example, direct selling companies might consider instituting, emphasizing, and/or communicating different recruiting, training, and retention programs for men and women.

There were no significant differences in self-perceived skills between urban and rural direct sellers or among survey participants with different lengths of time working with their current direct selling company. Similarly, there were generally no significant differences between millennials and non-millennials with respect to self-perceived business/professional skill levels resulting from their direct selling experience.

However, three self-perceived skills differed between millennials and non-millennials in the context of their personal lives. Proportionally more millennials than non-millennials agreed that their direct selling experience improved their decision-making skills (86% versus 78%), helped them improve their interpersonal relationships (87% versus 75%), and made them more able to cope with and manage stress in their personal lives (81% versus 70%). These differences suggest that consideration be given to creating different recruiting, training, and retention programs for millennials and non-millennials analogous to those for male and female direct sellers. Moreover, similar to the male and female direct seller differences observed, differences between millennials and non-millennials should be subjected to additional research.

In an absolute sense, a majority of all direct sellers studied, current as well as former, believed that both their business/professional and personal life skills were improved by their direct selling experience. From a relative perspective, though, current direct sellers believed that their direct selling experience improved all of the business/professional and personal life skills studied to a significantly greater degree than did former direct sellers. Moreover, self-perceived skill level differences between current direct sellers and former direct sellers were in general greater for personal life skills than for business/professional skills. For example, the largest difference between the two groups occurred for the self-perceived personal life skill “I am better at interpersonal relationships.” Seventy-nine percent of the current direct sellers somewhat or strongly agreed with this skill statement as compared with 52 percent of the former direct sellers who somewhat or strongly agreed with the statement. Such differences in perceptions may reflect better company training programs now than in the past, differences in the demographic makeup or motivations of the two groups, or a combination of differences in training programs and the demographic makeup or motivations of the two direct seller groups. Additional research is recommended.

Direct Selling Success

Survey participants were asked, “How successful do you consider yourself compared to other independent contractors in your direct selling company?” Based on a 7-category rating scale anchored by “much less successful” and “much more successful,” 45 percent of the survey participants who were current direct sellers rated themselves as successful (i.e., they responded “5,” “6,” or “7” on the scale). Using the same approach, only 25 percent of the former direct sellers considered themselves successful direct sellers. As before, this perceptual difference may be due to better company training programs now than in the past, differences between the two groups—including actual success—or both company training and direct seller characteristics. Indeed, to the extent that perceptions reflect reality, the self-perceived performance of former direct sellers may be a reason they left direct selling.

Responses to each of the 27 business/professional and personal life skill statements were significantly and positively related to responses to the self-perceived success scale (p<.001) for the current direct seller sample. Similarly, summary indices of business/professional and personal life skill responses respectively correlated significantly (p<.001) with self-perceived direct selling success. This means that survey participants who believed their direct selling experience improved their business/professional and personal life skills also believed they were more successful direct sellers than other direct sellers in their company. Again, if perceptions reflect reality, this implies that a direct selling company should target skill improvements during recruiting and training since doing so should benefit the company financially and its direct sellers both financially and personally.

Performance in Non-Direct Selling Jobs

Eighty percent of the survey participants who were current direct sellers stated that they also had a job other than direct selling. (This reinforces the conclusion that direct selling tends to be a part-time pursuit.) These survey participants (and former direct sellers surveyed) were asked whether they agreed or disagreed with the statement, “Because of my direct selling experience, I perform better in other, non-direct selling jobs,” using a 4-category rating scale ranging from “strongly disagree” to “strongly agree.” A substantial percentage of the survey participants who were current direct sellers and who held a non-direct selling job—84 percent—noted improved performance due to lessons learned through their direct selling experience. As might be expected, given differences in reasons for joining a direct selling company and self-perceived skill levels between current and former direct sellers, the percentage of current sellers (84%) believing their direct selling experience helped them perform better in a non-direct selling job was significantly larger than the corresponding percentage (66%) observed for former direct sellers. Likewise, proportionally more male direct sellers (90%) than female direct sellers (80%) believed their direct selling experience helped them perform better in a non-direct selling job.

Self-perceived performance in a non-direct selling job was significantly and positively correlated with self-perceptions of direct selling success. In addition, survey participants holding a non-direct selling job also believed that skills emanating from their direct selling experience improved their performance in their non-direct selling job. Moreover, survey participants who stated that one reason for joining a direct selling company was to improve their personal development (i.e., become more confident, better business-minded) also believed that skills emanating from their direct selling experience enhanced their performance in a non-direct selling job.

Finally, each of the 27 business/professional and personal life skills studied was significantly and positively correlated with perceived performance in a non-direct selling job. This finding corroborates the suggestion that a direct selling company target the improvement of skills of its direct sellers since doing so is beneficial to both the company and its direct sellers. When recruiting direct sellers, a company can communicate that even if a direct seller does not remain in direct selling, he or she can obtain skills that will improve performance in a non-direct selling job. Simultaneously, individuals considering a direct selling job may use that job to gain valuable skills that can be applied in a non-direct selling job as well as in their personal lives.

In brief, a substantial majority of the current direct sellers surveyed in this research—more than three-fourths of the individuals surveyed—agreed that their direct selling experience improved their skill levels for 14 business/professional skills and 13 personal life skills. Self-perceived skill levels were in turn related to perceptions of direct selling success. To the extent that current direct sellers believed that their direct selling experience improved their skill levels, they also believed that they were more successful than other direct sellers in their company.

Additionally, those direct sellers surveyed who also held a non-direct selling job believed that their direct selling experience improved their performance in this non-direct selling job. And, analogous to self-perceived direct selling success, the more direct sellers believed that their direct selling experience improved their business/professional and personal life skills, the better they perceived their non-direct selling job performance to be.

While these direct selling experience-related benefits existed across all direct sellers surveyed, certain groups of direct sellers (i.e. male direct sellers or millennial direct sellers), appeared to differ in the benefits gleaned from their direct selling experiences. As such, based on the present research, a direct selling experience can lead to personal as well as societal benefits that go beyond the economic value of direct selling per se. At a minimum, the present results suggest that an individual’s perceived self-efficacy can be enhanced due to a direct selling experience. Read full paper →

[1] See the DSEF report “Professional and Personal Benefits of a Direct Selling Experience” for a list of all reasons studied.

[2] See the DSEF report “Professional and Personal Benefits of a Direct Selling Experience” for a list of all skills studied.


The Economic Impact of Direct Selling Activity in the United States

By Dr. Robert A. Peterson

Direct selling is a business model that offers entrepreneurial opportunities to individuals who, as independent contractors, market products and services to consumers, typically outside of a fixed retail establishment through one-to-one selling, in-home product demonstrations, or online. Direct sellers are called distributors, representatives, consultants, associates, or various other titles. They may participate in direct selling in various ways, including selling products and services themselves or through their sales organizations, providing training and leadership to their sales organizations, referring customers to their company, and purchasing products and services for personal use. Compensation is ultimately based on sales and may be earned through personal sales and/or the sales of others in their sales organization.

In 2022, direct selling generated $40.5 billion in retail sales in the United States—the second-highest in direct selling history—and involved an estimated 6.7 million individuals who were actively engaged in building their own direct selling businesses and/or earning supplemental income.

Despite its ubiquity and contribution to the economy, the full economic impact of direct selling in the United States has not been formally or comprehensively assessed for nearly a decade. Therefore, the purpose of the present analysis was to estimate the economic impact of direct selling activity in 2022 through the application of an input-output economic model. Given the retail sales generated by direct selling (i.e., its Direct Effect), the model (implemented by means of IMPLAN® software and data) estimated the:

  • Indirect Effect (upstream or supply chain sales) due to direct selling and
  • Induced Effect (downstream sales due to household spending) associated with the Direct and Indirect Effects.

These three effects—Direct, Indirect, and Induced—collectively represent the economic impact of direct selling activity on the nation’s economy. In addition, the analysis estimated the fiscal (tax) implications of direct selling activity in the United States.

Executive Summary

An input-output economic analysis of 2022 direct selling sales activity was undertaken using IMPLAN® software and data obtained from the federal government.[1] Direct selling (retail) sales data were provided by the Direct Selling Education Foundation. The purpose of the analysis was to estimate the economic impact of direct selling activity in the United States in 2022. To provide a context for interpreting the 2022 economic impact of direct selling activity, the economic impact of direct selling activity in 2004, 2010, 2015, and 2016 was also investigated.

Results are reported in terms of Direct, Indirect, and Induced Effects using a measure of gross economic output sales dollars. Gross economic output refers to the cumulative value of production. Unlike Gross Domestic Product (GDP), gross economic output includes intermediate goods and services. (GDP is synonymous with total output less intermediate inputs.)

Using the Direct Selling Education Foundation estimate of $40.5 billion in direct selling (retail) sales in 2022 as a starting point, the total economic impact of direct selling activity in the United States in 2022 was estimated to be $111.4 billion. The $111.4 billion economic impact consisted of:

  • The Direct Effect of direct selling, $40.5 billion
  • The Indirect (upstream or supply chain) Effect of direct selling, $31.0 billion, and
  • The Induced (downstream or household) Effect of direct selling, $39.9 billion.

Because of (1) the analytic approach and (2) the nature of the industry (i.e., the widespread use of independent contractors), the total estimated economic impact of $111.4 billion should be considered conservative.

The derived multiplier emanating from the IMPLAN® analysis was 2.75. This multiplier means that nationally $1.00 in direct selling (retail) sales produced an economic impact of $2.75 in 2022. The 2022 derived multiplier is 18 percent larger than the 2016 derived multiplier (2.34) and 24 percent larger than the 2010 derived multiplier (2.21). These increases were primarily due to increases in the Induced Effect across the respective years.

In 2022, the economic impact of direct selling activity produced an estimated $9.5 billion in federal taxes and $6.0 billion in state and local taxes, or $15.5 billion in total taxes. This represents an increase of $4.9 billion (a 46% increase) in tax revenue from 2016. The total value of direct selling activity (i.e., the Direct, Indirect, and Induced Effects) added to the nation’s Gross Domestic Product in 2022 was estimated to be $111.4 billion, which represents an increase of $28.3 billion from 2016 (a 34% increase). Read full paper →

[1]  IMPLAN® is widely used in industry and government analyses. See www.implan.com.


DSEF Academic Engagement

Complete a brief survey to help us identify academic or university connections companywide.

This survey will help us learn more about:

  • The various partnerships each department has with a professor, college or university.
  • The existing connections that our employees may have with a university.
  • How our team can better support or align with these relationships.

Please provide us with the following contact information:

Do you or your department have an ongoing professional partnership or personal relationship with a university, college professor, program or department?