All posts in Industry Reports

Inside the Modern Direct Selling Channel and Salesforce

By Monica Wood

Direct selling occupies a unique space at the intersection of entrepreneurship, retail, and the evolving independent workforce. While often associated with product categories such as wellness, beauty, household goods, and services, direct selling is fundamentally a distribution channel through which companies reach consumers using networks of independent sellers rather than traditional retail storefronts. These independent sellers introduce products to customers through personal relationships, social networks, online communities, and direct recommendations, creating a highly personalized purchasing experience.

This article offers a look into the broader economic and workforce trends of the channel. As Americans increasingly seek flexible ways to develop entrepreneurial skills or pursue work that fits around family and career obligations, direct selling continues to offer a low-barrier entry point to independent work. Unlike many traditional small businesses, participation typically requires minimal upfront investment and allows individuals to engage on a part-time, full-time, or occasional basis according to their goals and circumstances.

At the same time, consumer expectations are changing. Many shoppers increasingly value personalized service, trusted recommendations, community connections, and convenient purchasing experiences that blend digital and social engagement. These shifts have encouraged direct selling companies to modernize their business models, adopt new technologies, and invest in innovative approaches to customer acquisition and relationship-building. Recent research also indicates growing consumer interest in both the products offered through direct selling and the entrepreneurial opportunities the channel provides.

The DSEF Direct Selling Growth & Outlook Survey provides an annual snapshot of the size, scope, and direction of this people-powered channel. Audited by an independent third-party economic consulting firm, the study tracks key indicators including retail sales, customer participation, and salesforce engagement, offering business leaders, researchers, regulators, and policymakers valuable insights into one of America’s largest entrepreneurial and relationship-driven distribution channels. The data and findings presented throughout this article are derived from the survey results and estimates of the DSEF 2026 Growth & Outlook Study based on 2025 industry data and trends.

A deeper analysis of the direct selling channel in the United States reveals encouraging trends that underscore the resilience and adaptability of the channel.

A critical driver of this resilience is the continued strength of its core salesforce, particularly women and Hispanic entrepreneurs, who represent a vital foundation of the channel’s growth and cultural relevance. Their strong participation not only fuels sales activity but also enhances community trust, expands market reach, and reflects the increasingly diverse face of entrepreneurship in the United States.

The rapid growth of service-based offerings, improved workforce stability, and alignment with modern consumer behavior collectively point toward a strong and sustainable future. By embracing innovation while maintaining its core strengths — flexibility, personalization, and entrepreneurial opportunity — the direct selling channel is well-positioned to thrive in the years ahead.

Importantly, the channel’s accessibility continues to create meaningful economic opportunities, especially for women seeking flexible work and for Hispanic communities that are driving population and small business growth nationwide. This demographic strength reinforces the channel’s ability to remain relevant and responsive to evolving consumer needs.
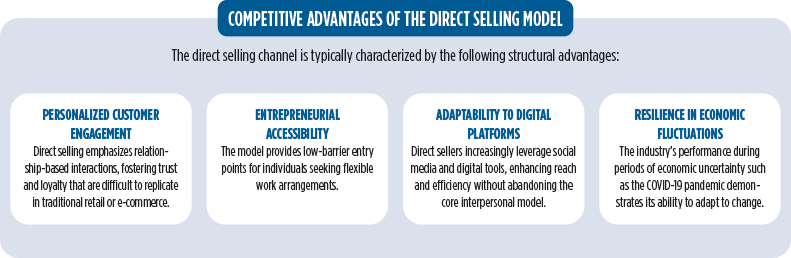
Competitive Advantages of the Direct Selling Model infographic

Direct Selling Retail Sales in the US

Direct selling in the United States represents $34.2 billion in retail sales in 2025. In addition, there were 34.8 million customers and 5.2 million full- and part-time direct sellers.

Source: DSEF Growth & Outlook annual industry sizing report.

Direct Sellers and Customers

A total of 5.2 million direct sellers engaged in either full-time (30 or more hours per week) or part-time (fewer than 30 hours per week) business activities. These individuals market products and services directly to consumers and may also recruit others to join their sales network.

Full-time direct sellers: 0.4 million

Part-time direct sellers: 4.8 million
5.2 million direct sellers operate in the U.S.

Source: DSEF Growth & Outlook annual industry sizing report.

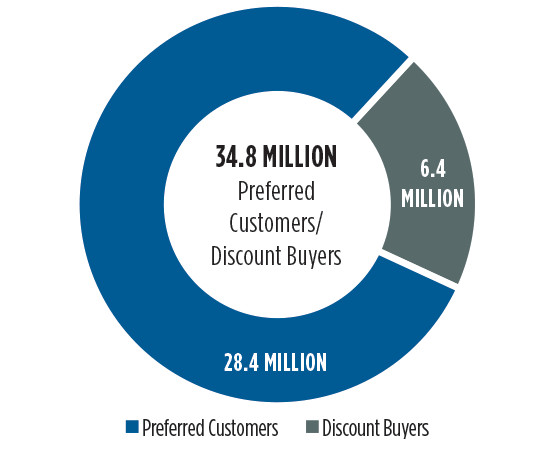
A total of 34.8 million individuals are classified as Preferred Customers and Discount Buyers. Discount buyers are eligible to purchase, sell, and sponsor, but are product lovers, only purchasing products/services they personally enjoy and use at a discount. Preferred customers have signed a preferred customer agreement with a direct selling company where they may be eligible to pay wholesales prices for products/services. They are not eligible to sell products/services to others, and they are not eligible to earn.

Direct selling preferred customers: 28.4 million

Direct selling discount buyers: 6.4 million
Source: DSEF Growth & Outlook annual industry sizing report.

Demographic Profile of the Direct Selling Sales Force

Source: DSEF Growth & Outlook annual industry sizing report.

Source: DSEF Growth & Outlook annual industry sizing report.

Demographics include both direct sellers and discount buyers

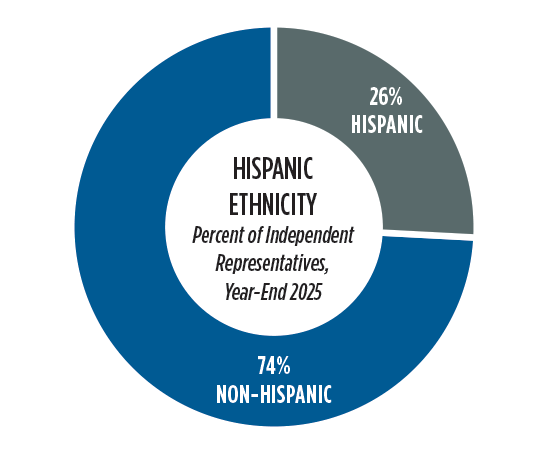
Hispanic participation in direct selling increased to 26% in 2025. According to U.S. Census Bureau estimates, the Hispanic and Latino population represents approximately 20% of the total U.S. population.
Hispanic Ethnicity

Source: DSEF Growth & Outlook annual industry sizing report.

Source: DSEF Growth & Outlook annual industry sizing report.

Women and Hispanic participants represent two of the most important and defining demographic segments in the U.S. direct selling channel. Women dominate participation, accounting for 73% of all direct sellers and discount buyers. The level of participation by women historically aligns with the need for balancing flexible independent work with personal or family responsibilities.

At the same time, Hispanic individuals make up about 26% of participants, a significant share that highlights the channel’s effectiveness in engaging diverse communities. Based on the DSEF 2023 National Salesforce Study, “Sellers who are newer to direct selling are more likely to be Hispanic, be younger, and represent multiple companies.” The importance of Hispanic sellers is amplified by their demographic growth and strong community networks, which naturally complement relationship-based selling models. Together, women and Hispanic entrepreneurs not only drive a substantial portion of direct selling activity but also reinforce its inclusive, grassroots nature — fueling both economic opportunity and deeper consumer connection across the U.S. market.

National Direct Selling by State

In 2025, direct selling activity remained highly concentrated in several leading states, with California and Texas maintaining the largest participation and highest sales volumes. California led the nation with approximately 1.26 million individuals engaged in direct selling, generating an estimated $3.6 billion in sales. Texas closely followed, with about 1.25 million participants and $3.3 billion in sales.

Florida ranked third, demonstrating strong engagement with 843,845 individuals and total sales of $2.3 billion. New York held the fourth position, recording 524,907 participants and $1.8 billion in sales revenue. Illinois followed, with 463,647 individuals involved and $1.3 billion in direct sales.

Several other states showed steady performance in both participation and revenue generation. North Carolina reported 416,216 participants and $1.2 billion in sales, while Pennsylvania recorded 366,407 individuals and $1.1 billion. Wisconsin and Ohio also contributed significantly, with 315,459 and 383,937 participants respectively, each generating approximately $1.1 billion in sales. Georgia completed the top ten, with 340,361 individuals engaged in direct selling and total sales reaching $1.1 billion.

Overall, these figures highlight the continued importance of direct selling as a substantial economic activity across US states, characterized by broad participation and significant revenue contribution.

A detailed breakdown of direct sales volume and the number of direct sellers by state is below.


State/Territory People involved in direct Selling Retail Sales
Alabama 169,970 $450M
Alaska 16,566 $65M
Arizona 225,267 $692M
Arkansas 84,570 $280M
California 1,258,468 $3.6B
Colorado 294,345 $765M
Connecticut 88,242 $287M
Delaware 34,701 $99M
Florida 843,845 $2.3B
Georgia 340,361 $1.1B
Hawaii 24,516 $150M
Idaho 91,275 $249M
Illinois 463,647 $1.3B
Indiana 287,240 $837M
Iowa 151,664 $568M
Kansas 133,397 $343M
Kentucky 143,028 $422M
Louisiana 128,110 $442M
Maine 33,103 $89M
Maryland 204,825 $627M
Massachusetts 132,404 $487M
Michigan 319,795 $939M
Minnesota 228,715 $629M
Mississippi 81,963 $288M
Missouri 214,223 $618M
Montana 57,877 $163M
Nebraska 119,394 $371M
Nevada 97,020 $306M
New Hampshire 28,427 $103M
New Jersey 274,881 $842M
New Mexico 76,930 $201M
New York 524,907 $1.8B
North Carolina 416,216 $1.2B
North Dakota 54,821 $148M
Ohio 383,937 $1.1B
Oklahoma 153,457 $472M
Oregon 141,787 $378M
Pennsylvania 366,407 $1.1B
Rhode Island 23,738 $51M
South Carolina 186,684 $527M
South Dakota 72,858 $263M
Tennessee 222,579 $679M
Texas 1,247,602 $3.3B
Utah 134,830 $489M
Vermont 12,070 $35M
Virginia 287,018 $889M
Washington 198,771 $592M
West Virginia 55,829 $170M
Wisconsin 315,459 $1.1B
Wyoming 34,962 $96M
District of Columbia 8,000 $14M
Guam 2,377 $6M
Puerto Rico 65,694 $181M
U.S. Virgin Islands 1,010 $2M
N. Mariana Islands 174 $0M
American Samoa 0 $0M
Overseas U.S. Military 42 $0.2M


Salesforce Stability: A Significant Advantage

One of the most encouraging findings in the data is the consistently lower turnover rate in direct selling compared to traditional retail.

  • In 2025, the turnover rate for direct selling was approximately 43.3%, compared to 45.2% in retail trade.
  • This trend persists over multiple years, with direct selling consistently exhibiting lower turnover.

Lower turnover rates suggest:

Greater Salesforce Satisfaction
Individuals engaged in direct selling may value the flexibility and autonomy offered by the model.

Stronger Retention Mechanisms
Compensation structures, community-building efforts, and personal development opportunities contribute to sustained engagement.

Collectively, these factors may indicate a stable and resilient direct selling salesforce — an essential component of long-term industry success.

Key Takeaways

  • Salesforce Strength: Lower turnover rates compared to retail indicate strong retention and workforce satisfaction.
  • Sustainable Recruitment: Recruitment trends are stabilizing, reflecting renewed interest and improved selectivity.
  • Resilience and Adaptability: The industry continues to adapt to digitalization and changing consumer preferences.
  • Flexible & Accessible Engagement: The industry continues to offer flexible opportunities, with the majority (4.8 million) participating part-time, supporting a wide range of lifestyles.
  • Expanding Customer Reach: A growing base of 34.8 million customers highlights sustained consumer interest and strong market engagement.
  • Inclusive & Evolving Workforce: The sales force remains women-led (73%), spans multiple age groups, and shows increasing diversity, with Hispanic representation rising to 26%.
  • Broad Nationwide Engagement: Multiple states demonstrate significant participation and solid revenue generation, reflecting widespread adoption.
  • Sustained Economic Impact: Consistent contributions across all 50 states highlight direct selling as a stable and valuable economic driver nationwide.

Conclusion

Overall, the direct selling channel continues to demonstrate strong adaptability, steady customer growth, and increasingly inclusive participation — with women and Hispanic sellers playing a central and expanding role — reinforcing its position as a flexible and accessible pathway to entrepreneurship for a diverse population.

The channel continues to demonstrate regional leadership, broad nationwide participation, and consistent economic impact based on data presented in the Economic Impact of Direct Selling in the United States report, further amplified by the influence and engagement of female and Hispanic salesforce segments. Together, these factors reinforce its importance as a thriving and impactful channel across the United States.


Monica Wood is the Vice President of Consumer and Member Insights at Herbalife and Chair of the DSEF Industry Research Committee.
 

The Economic Impact of Direct Selling Activity in the United States

By Robert A. Peterson, PhD

Introduction

Direct selling is a business model that offers entrepreneurial opportunities to individuals who, as independent contractors, market products and services to consumers, typically outside of a fixed retail establishment through one-to-one selling, in-home product demonstrations, or online. Direct sellers have job titles such as distributor, representative, consultant, associate, or brand partner. They may participate in direct selling in various ways, including selling products and services themselves or through their sales organizations, providing training and leadership to their sales organizations, referring customers to their company, and purchasing products and services for personal use. Compensation is ultimately based on sales and may be earned through personal sales and/or the sales of others in their sales organization.

In 2024, direct selling generated $34.7 billion in retail sales in the United States and involved an estimated 5.4 million individuals who were actively engaged in building their own direct selling businesses.

Despite its ubiquity and contribution to the economy, the full economic impact of direct selling in the United States is often understated. Therefore, the purpose of the present analysis was to estimate the economic impact of direct selling activity in 2024 through the application of an input-output economic model. Given the retail sales generated by direct selling (i.e., its Direct Effect), the model (implemented by means of IMPLAN® software and data) estimated the

  • Indirect Effect (upstream or supply chain sales) due to direct selling and
  • Induced Effect (downstream sales due to household spending) associated with the Direct and Indirect Effects.

Collectively, these three effects—Direct, Indirect, and Induced—represent the economic impact of direct selling activity on the nation’s economy. In addition, the analysis estimated the fiscal (tax) implications of direct selling activity in the United States.

Executive Summary

An input-output economic modeling of 2024 direct selling sales activity was undertaken using IMPLAN® software and data obtained from the federal government[1]. Direct selling (retail) sales data were provided by the Direct Selling Education Foundation (DSEF). The purpose of the modeling was to estimate the economic impact of direct selling activity in the United States in 2024.

Results are reported in terms of Direct, Indirect, and Induced Effects using a measure of gross economic output, sales dollars. Gross economic output refers to the cumulative value of production. Unlike Gross Domestic Product (GDP), gross economic output includes intermediate goods and services. (GDP is synonymous with total output less intermediate inputs.)

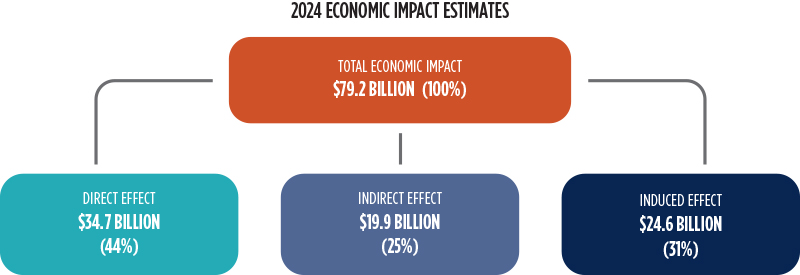
Using the DSEF estimate of $34.7 billion in direct selling (retail) sales in 2024 as a starting point, the total economic impact of direct selling activity in the United States in 2024 was estimated to be $79.2 billion. The $79.2 billion economic impact consisted of

  • The Direct Effect of direct selling, $34.7 billion
  • The Indirect (upstream or supply chain) Effect of direct selling, $19.9 billion, and
  • The Induced (downstream or household) Effect of direct selling, $24.6 billion.

Because of (1) the modeling approach and (2) the nature of the industry (e.g., the widespread use of independent contractors), the total estimated economic impact of $79.2 billion should be considered conservative.

The derived multiplier emanating from IMPLAN® modeling was 2.28. This multiplier means that nationally $1.00 in direct selling (retail) sales produced an economic impact of $2.28 in 2024.

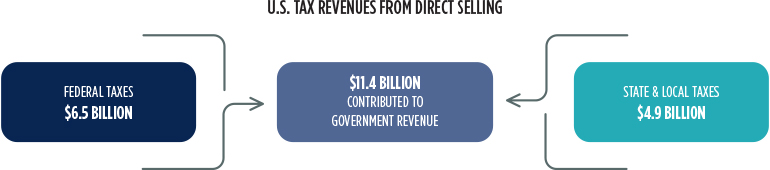
In 2024, the economic impact of direct selling activity produced an estimated $6.5 billion in federal taxes and $4.9 billion in state and local taxes, or $11.4 billion in total taxes. The total value of direct selling activity (i.e., the Direct, Indirect, and Induced Effects) added to the nation’s Gross Domestic Product in 2024 was estimated to be $79.2 billion.

Overview and Methodology

The present modeling estimated the economic impact of direct selling activity in the United States in 2024 using the IMPLAN® input-output economic model. Specifically, in the present context, gross economic activity refers to sales dollars generated and distributed throughout the United States economy. The sources of activities that sum to economic output consist of both capital expenditures and operating expenditures, including spending on goods and services by direct selling firms, the Direct Effect, as well as by firms within the direct selling supply chain, which leads to the Indirect Effect, and off-site spending on goods and services by households in which a member earns income from a direct selling company or supply chain company, the Induced Effect.

A series of multipliers link Direct, Indirect, and Induced Effects. These multipliers are based on data compiled by several federal entities and include the Bureau of Economic Analysis Benchmark Input-Output Tables. (See Appendix for details.) A summary metric, the derived or implied direct selling multiplier, estimates the impact of one direct selling sales (retail) dollar on gross economic output due to inter-industry and industry-employee household relationships between the direct selling industry and other industries.
Conceptually, the multipliers quantify the economic ripple effect of inter-industry economic activity. This ripple effect can be positive or negative depending on whether a modeled entity is expanding or contracting. Multipliers are static and do not account for disruptive shifts in infrastructure without specifically addressing infrastructure changes. The present model applies the most current (2024) IMPLAN® multipliers.

Data

DSEF conducts an annual “Growth & Outlook” market-sizing survey to estimate the size and scope of the direct selling industry in the United States. It engages Cadmus, an international consulting firm, to conduct this survey, perform secondary research, and generate industry-wide estimates.

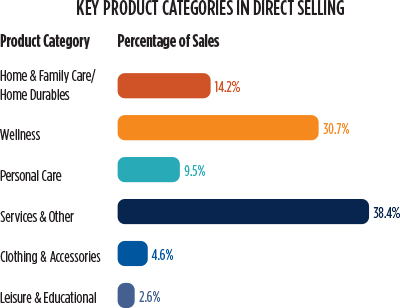
Cadmus market-sizing estimates are reviewed and further refined by DSEF. Results that are reported include total direct selling (retail) sales as well as (retail) sales estimates by selected geographical regions, by compensation structure of direct selling firms, by sales strategy, and by major product categories. The six product categories utilized in the present analysis are:[2]

  • Wellness—Weight management products and programs, nutritional supplements, sports/energy and body-building, health foods and beverages, children’s supplements, health/nutrition/fitness instructional materials, and essential oils and pharmacy.
  • Services—Financial services, telecommunications, internet services, energy, legal services, group buying, and travel services.
  • Home and Family Care and Home Durables—Home and auto care cleaning products, and food and beverages (excluding those in the wellness category). Home durables includes cookware, cutlery, house/kitchenware, various home gifts, and home appliances.
  • Personal Care—Cosmetics, skin care, fragrances, hair and nail care, and various toiletry products.
  • Clothing and Accessories—Clothing, lingerie, sleepwear, shoes, jewelry, and fashion accessories.
  • Leisure and Educational—Books, encyclopedias, educational publications, computer software, crafts, and toys and games.


The DSEF’s 2025 Growth & Outlook Report (retail) sales estimate formed the basis of IMPLAN® modeling. Specifically, according to the DSEF, direct selling (retail) sales totaled $34.7 billion in 2024. The $34.7 billion in direct selling (retail) sales was initially modeled in IMPLAN® with margins applied. This was equivalent to identifying the economic impact of operating a business with $34.7 billion in retail sales. It excluded the manufacturing, wholesaling, and transporting of goods, and included only the economic activities associated with direct selling companies.

Wholesaling and manufacturing Indirect Effects of direct selling activity due to the industry supply chain were sequentially modeled by respectively applying margins to direct selling (retail) sales activity and wholesale sales activity. For wholesaling, this allowed the identification of the economic effects of operating the equivalent of a wholesale business. The wholesale industry modeling included transportation but excluded the effect and supply chain of the manufacturing component.

Manufacturing activity was estimated after applying margins to and subtracting direct selling economic activity and wholesaling economic activity. Manufacturing sales activity was modeled using the six product groups (e.g., wellness, personal care, etc.) above.

The Induced Effect of direct selling activity was estimated for each sector modeled (i.e., retailing, wholesaling, and manufacturing) and aggregated to reflect its total estimated economic impact.

Taxes attributable to direct selling activity were also estimated using the IMPLAN® model. The tax estimates provided in this report include tax revenue derived from direct, indirect, and induced sales activity. The national economic impact tax estimate includes both federal taxes and state/local taxes.

Economic Impact

The $34.7 billion in direct selling (retail) sales nationally contributed a total economic impact of $79.2 billion to the national economy in 2024 through its combined indirect and induced effects. As shown above, the 2024 national economic impact included $34.7 billion in direct selling sales activity, $19.9 billion in indirect sales activity, and $24.6 billion in induced sales activity.

The derived (implied) multiplier resulting from IMPLAN® modeling summarizes the economic impact of one direct selling (retail) sales dollar ($1) on the national economy. It is calculated as the total economic impact divided by the direct effect (i.e., $79.2B/$34.7B = 2.28 in 2024). Thus, for example, $1 in direct selling sales (the direct effect) generated a total economic impact of $2.28 in 2024. The derived multiplier in 2024 is somewhat smaller than derived multipliers observed in other retailing sectors (approximately 2.44 on average).

Fiscal Impact

Tax impacts estimated by IMPLAN® are respectively categorized as federal taxes and state and local taxes. IMPLAN® quantifies tax impacts based on employee compensation, proprietor income, and taxes on production and imports, households, and corporations. Estimated taxes range from federal and state income taxes and property taxes to sales taxes and motor vehicle licenses. As such, the estimated total (direct, indirect, and induced) federal, state, and local tax revenues attributable to direct selling activity in the United States in 2024 were $11.4 billion. Federal tax revenues attributable to the $34.7 billion in direct selling activity were estimated at $6.5 billion in 2024. State and local taxes attributable to direct selling activity were estimated at $4.9 billion in 2024.

About IMPLAN®

IMPLAN® is an input-output economic model based on aggregating and connecting a multitude of economic databases, foremost of which are the Bureau of Economic Analysis (United States Department of Commerce) Benchmark Input-Output Tables.[3] It consists of both software and data that together permit detailed estimates of various economic impacts. The IMPLAN® model quantifies inter-industry relationships within an economy by documenting how the output of one industry becomes the input of another industry. Through a backward-linking process, the present modeling captured the relationship between economic activity in the direct selling industry and economic activity in its (general) supply chain (i.e., the Indirect Effect of direct selling activity on the wholesaling and manufacturing firms in the direct selling industry supply chain) as well as the ancillary (household) effect that direct selling activity has on the economy (i.e., the Induced Effect).

The primary databases contained and used in IMPLAN® modeling are respectively compiled and updated by the United States Census Bureau, the United States Bureau of Economic Analysis, the United States Department of Agriculture, and the United States Bureau of Labor Statistics.

Numerous multipliers were used in the present analysis to link the six (aggregated) product categories and the manufacturing sector (which were in turn linked to the wholesale and retail sectors). In particular, product subcategories were matched with 6-digit NAICS codes which were in turn linked to their respective 528 IMPLAN® sectors. Because the Nonstore Retailers Sector encompasses more establishments than those traditionally defined as direct selling companies, its associated multiplier might be somewhat attenuated. However, any possible attenuation was not believed to substantially affect the results of the estimation process or the final economic impact estimation due to limiting the modeling to particular product categories.

Specifically, when modeling the manufacturing sector, the multipliers associated with the six direct selling product categories incorporated the categories’ relative sales and the percentage of category manufacturer sales that originated in the United States (based on federal data sources). The 2024 direct selling (retail) sales percentages were based on the DSEF’s 2025 Growth & Outlook Report estimates, whereas the 2024 domestic purchasing percentages (related to local purchasing coefficients in IMPLAN®) were based on 2023 federal statistics.

Within the six product categories, subcategories were aggregated to form each respective product category. For instance, as previously shown, two IMPLAN® subcategories (Clothing, Lingerie, Sleepwear and Shoes, and Jewelry and Fashion Accessories) were aggregated to create the Clothing & Accessories product category. Trade flows and industry data for the subcategories were combined in IMPLAN®, and multipliers were generated by IMPLAN® software. (Note: the combination was not a simple average.) To the extent that product category data do not comport exactly with direct selling product offerings or sales, the multipliers might be somewhat attenuated. However, the consequence of such potential attenuation was not deemed substantial.

The overall derived multiplier, 2.28, was composed of the Direct Effect implied multiplier 1.00, the Indirect Effect implied multiplier .57, and the Induced Effect implied multiplier .71.

Where appropriate, default values of the IMPLAN® software were applied during modeling. Consequently, all estimated values—multipliers as well as effects and impacts—should be considered conservative.

[1] IMPLAN® is widely used in industry and government analyses. See www.implan.com
[2] The product categories include, but are not limited to, the illustrative subcategories.
[3] Frances Day, “Principles of Impact Analysis & IMPLAN® Applications.” IMPLAN® stands for IMpact Analysis for PLANning.


Dr. Robert Peterson is Professor Emeritus of Marketing and John T. Stuart III Centennial Chair of Marketing (Emeritus) at The University of Texas.

References

  • Direct Selling Education Foundation. 2025 Growth & Outlook Report.
  • IMPLAN Group, LLC. IMPLAN® 2023. Huntersville, NC. IMPLAN.com.
  • Robert A. Peterson. The Economic Impact of Direct Selling Activity in the United States in 2016.
  • Robert A. Peterson. The Economic Impact of Direct Selling Activity in the United States in 2022.
  • United States Bureau of Economic Analysis. Real Gross Domestic Product, Chained Dollars, bea.gov.
  • United States Bureau of Economic Analysis. Personal Income and Its Disposition, Monthly, bea.gov.
  • United States Census Bureau. Retail and Food Services Sales, census.gov.
  • United States Census Bureau. Nonemployer Statistics by Legal Form of Organization and Receipts Size Class for the United States, States, and Selected Geographies, census.gov.

Acknowledgment

Appreciation is expressed to the Business Research Division, Leeds School of Business, University of Colorado, Boulder, for its analytical support.

Join, Stay, Leave: A Study of Direct Selling Distributors

By Dr. Anne T. Coughlan, Dr. Manfred Krafft, and Dr. Julian Allendorf

This paper uses a unique dataset of over 13,000 individual direct selling distributors from dozens of firms, at a wide variety of stages in their direct selling experiences, to investigate the motivations to join, stay, and leave a direct selling distributorship. We build on the literatures in sales force management and compensation, economics, organizational behavior, psychology and sociology to develop hypotheses both about each of these key decisions a distributor makes, as well as the interlinkages among the join, stay, and leave junctures in the distributor’s life cycle. Our analysis shows that many insights from these underlying academic research paradigms are robust to the direct selling situation, while others are not supported—suggesting that direct selling has many parallels, but is not a replica of, other non-direct-selling sales channels.

We find that individuals join as direct selling distributors for a variety of reasons, many of which combine multiple aspects of direct selling that a cluster of distributors finds attractive. Only a small proportion of joiners sign up purely for personal consumption of the direct selling firm’s products—but a great majority do join for this and other reasons as well. We further find that stated reasons for joining are frequently replaced by other motivations for staying as a direct selling distributor, consistent with the idea that distributors join without always knowing what direct selling will offer to them; they learn in the process of doing it. We also link certain traits as well as certain joiner and stayer types to the likelihood that a distributor will leave the firm; but interestingly, we do not find that a distributor’s reasons for joining have a relationship with his/her likelihood of leaving. Thus, the join/stay/leave life cycle path does show linkages from each stage to the next, but its failure to directly link join reasons to likelihood to leave is consistent with the learning that naturally occurs as distributors develop. Read full paper →

Managerial Implications:

  • Keep it easy, inexpensive to join, & easy to leave.
  • Poll your new distributors to learn their join-type and cultivate those who identify as social sellers and enthusiasts.
  • Communicate realistic expectations, do not over-promise—important for both “stay for business+social” and for “low intention to leave” distributor types.
  • There are many reasons for joining, staying
    and leaving.
  • Clearly communicate Rules of Conduct—direct ship has made inventory loading much less likely.
  • Poll stayers for signs of intention to leave because nature and nurture are both at work.
  • Invest in training/mentoring distributors in skills that increase productivity and retention: selling, landing new customers, recruiting/mentoring.
  • Cultivate financially successful stayers (retail sellers, income earners) à lower turnover.

Policy Implications:

  • Not all motivations are financial—there are many reasons for joining, staying or leaving a direct selling company.
  • Policy requirement to offer “preferred customer” status isn’t inherently good: most do not join solely for product discounts, but most do mention product discounts as one benefit.
  • Allow flexibility in ability to enjoy different direct selling distributor roles, at any given time across distributors and over a given distributor’s life cycle (social, not just income, can connote “success”).
  • Turnover is not diagnostic of poor performance or pyramid scheme threat—turnover is most likely in first year, when “learning on the job” about one’s fit with direct selling happens.
  • Judging a direct selling company by distributor income, “losses,” or turnover is not diagnostic of viability of business—even leavers do not uniformly blame the company.

The Economic Impact of Direct Selling Activity in the United States

By Dr. Robert A. Peterson

Direct selling is a business model that offers entrepreneurial opportunities to individuals who, as independent contractors, market products and services to consumers, typically outside of a fixed retail establishment through one-to-one selling, in-home product demonstrations, or online. Direct sellers are called distributors, representatives, consultants, associates, or various other titles. They may participate in direct selling in various ways, including selling products and services themselves or through their sales organizations, providing training and leadership to their sales organizations, referring customers to their company, and purchasing products and services for personal use. Compensation is ultimately based on sales and may be earned through personal sales and/or the sales of others in their sales organization.

In 2022, direct selling generated $40.5 billion in retail sales in the United States—the second-highest in direct selling history—and involved an estimated 6.7 million individuals who were actively engaged in building their own direct selling businesses and/or earning supplemental income.

Despite its ubiquity and contribution to the economy, the full economic impact of direct selling in the United States has not been formally or comprehensively assessed for nearly a decade. Therefore, the purpose of the present analysis was to estimate the economic impact of direct selling activity in 2022 through the application of an input-output economic model. Given the retail sales generated by direct selling (i.e., its Direct Effect), the model (implemented by means of IMPLAN® software and data) estimated the:

  • Indirect Effect (upstream or supply chain sales) due to direct selling and
  • Induced Effect (downstream sales due to household spending) associated with the Direct and Indirect Effects.

These three effects—Direct, Indirect, and Induced—collectively represent the economic impact of direct selling activity on the nation’s economy. In addition, the analysis estimated the fiscal (tax) implications of direct selling activity in the United States.

Executive Summary

An input-output economic analysis of 2022 direct selling sales activity was undertaken using IMPLAN® software and data obtained from the federal government.[1] Direct selling (retail) sales data were provided by the Direct Selling Education Foundation. The purpose of the analysis was to estimate the economic impact of direct selling activity in the United States in 2022. To provide a context for interpreting the 2022 economic impact of direct selling activity, the economic impact of direct selling activity in 2004, 2010, 2015, and 2016 was also investigated.

Results are reported in terms of Direct, Indirect, and Induced Effects using a measure of gross economic output sales dollars. Gross economic output refers to the cumulative value of production. Unlike Gross Domestic Product (GDP), gross economic output includes intermediate goods and services. (GDP is synonymous with total output less intermediate inputs.)

Using the Direct Selling Education Foundation estimate of $40.5 billion in direct selling (retail) sales in 2022 as a starting point, the total economic impact of direct selling activity in the United States in 2022 was estimated to be $111.4 billion. The $111.4 billion economic impact consisted of:

  • The Direct Effect of direct selling, $40.5 billion
  • The Indirect (upstream or supply chain) Effect of direct selling, $31.0 billion, and
  • The Induced (downstream or household) Effect of direct selling, $39.9 billion.

Because of (1) the analytic approach and (2) the nature of the industry (i.e., the widespread use of independent contractors), the total estimated economic impact of $111.4 billion should be considered conservative.

The derived multiplier emanating from the IMPLAN® analysis was 2.75. This multiplier means that nationally $1.00 in direct selling (retail) sales produced an economic impact of $2.75 in 2022. The 2022 derived multiplier is 18 percent larger than the 2016 derived multiplier (2.34) and 24 percent larger than the 2010 derived multiplier (2.21). These increases were primarily due to increases in the Induced Effect across the respective years.

In 2022, the economic impact of direct selling activity produced an estimated $9.5 billion in federal taxes and $6.0 billion in state and local taxes, or $15.5 billion in total taxes. This represents an increase of $4.9 billion (a 46% increase) in tax revenue from 2016. The total value of direct selling activity (i.e., the Direct, Indirect, and Induced Effects) added to the nation’s Gross Domestic Product in 2022 was estimated to be $111.4 billion, which represents an increase of $28.3 billion from 2016 (a 34% increase). Read full paper →

[1]  IMPLAN® is widely used in industry and government analyses. See www.implan.com.